Sprawl’s inflection point was 20 years ago

Sprawl is slowing

According to the USDA’s 2010 National Resources Inventory, which tracks land use with satellite imaging surveys, the inflection point for suburban sprawl peaked in the mid-1990s, just as “smart growth” emerged onto the national scene — and before the giant housing bubble showered suburbs with seemingly limitless sums of capital. It’s been slowing ever since then, even though metro population growth moderated only slightly (see graphs on page 3). (Interestingly, non-metro population growth [including distant exurbs] in the 2000s fell much faster than metro population growth.)

It’s interesting that the slowdown in sprawl, like the slowdown in mall construction, presaged “peak car.” The directionality might be backwards: the 1980s cessation of massive freeway construction may have pushed many metro areas into some version of Marchetti’s Wall, whose daily-travel-time maximum creates a geometric limit for autocentric growth at the edge. Edge Cities, by relocating commercial uses into the inner suburbs, could only extend the outward trend so far; with a few notable examples, attempts at building Edge Cities in outer-ring suburbs has largely failed, since there’s no meaningful centrality amidst the undifferentiated masses of one-acre lots. Second-generation Edge Cities rarely thrived, because without new beltways there just wasn’t the population base to feed them.

To this day,* 80% of the office market in metro DC is within three miles of the Beltway. Joel Garreau wrote that in the late 1980s, Til Hazel “had major projects at half the exits on Interstate 66 from the Beltway to… Manassas,” but ultimately, that future didn’t pan out (with Reston-Herndon as the notable exception that proves the rule). Even in metro Boston, which uniquely among its East Coast brethren actually built an outer beltway, 73% of the office market is within the urban core or inner ring, and the urban core commands per-foot prices more than twice as high.

If you consider that the area of a circle grows with the square of its radius, a slowdown in the areas developed for sprawl would imply a much steeper decrease in the radius of metro expansion. This could imply another overlooked factor in the slowdown in VMT growth: since metro areas are no longer getting geometrically wider, thus distances between metro-area destinations are no longer growing as fast. As growth recentralizes, VMT can be expected to decline further. (A majority of the VMT benefits from central locations come from the fact that car trips are shorter; a minority of the befits come from a switch to other modes.)

* Using Cassidy Turley‘s submarket definitions.

How would a carbon tax affect DC?

Nature's fuel

The right thing in climate policy for all the big countries is a carbon tax, which is simpler and less vulnerable to fluctuations in emissions than cap-and-trade schemes.” – The Economist

A recent discussion spawned the idea of implementing a carbon tax within DC, and so I wrote up this brief.

What and whom would a carbon tax affect?
A carbon tax, technically a tax upon the carbon content of energy and fuels, would primarily affect electric generation, gasoline & diesel, and heating fuels (natural gas, fuel oil). A narrower tax could affect only fuels, or electricity. The UK’s carbon tax, for instance, taxes various energy sources at differing rates.

Who consumes energy in D.C., and how?
The EIA reports that DC’s total energy consumption is 70.5% imported electricity, 18.7% natural gas, 7.9% gasoline, and 2.7%fuel oil. 66.3% of energy is consumed by the commercial sector (i.e., offices), 19.9% by residences, 12.1% by transportation (i.e., cars & trucks), and 1.6% by industry.

Of carbon emissions within DC proper in 2010, natural gas was 54.6% and petroleum 45.2%. Because DC imports all of its electricity, it has the least carbon intense economy among the states, emitting 91.6% less CO2 per dollar of GDP than the US average. This does not, however, include fuel burned for electricity used by DC end users; 59.2% of DC electricity originated from fossil fuel generators.

Have carbon taxes been implemented elsewhere?
Yes, several jurisdictions have. Finland and Sweden were first, in 1990 and 1991. In North America, the provinces of British Columbia and Quebec have carbon taxes, as does the city of Boulder (on electricity only). Dozens of multinational corporations, including most oil majors, use an “internal carbon price” to evaluate corporate decisions: ExxonMobil’s is $60/ton.

How have these fared?
British Columbia’s carbon tax, unique in its broad reach even though the province works within the framework of a high-carbon-emitting country, “has been remarkably effective in reducing fuel use, with no apparent adverse impact on the province’s economy,” according to a University of Ottawa study. GDP growth paralleled Canada’s, income tax rates fell to the lowest nationwide, and fuel consumption fell by 17.4% per capita.

Have carbon taxes been proposed in U.S. states?
A bill has been introduced in the Massachusetts legislature, and a ballot measure is currently collecting signatures. In Washington state, Governor Jay Inslee has specifically directed a legislative commission to study a carbon tax, and an NGO has proposed draft legislation.

What level of tax would be appropriate?
An easy guideline for measuring the impact of a carbon tax is that a tax of $1 per ton of CO2 results in just less than 1¢ in tax per gallon of gasoline. DC’s current gas tax rate of 23.5¢ per gallon thus implies a tax rate of $27.98/ton of carbon dioxide. (Maryland’s gas tax is now 32.10¢ per gallon.) This rate is very similar to the C$30/ton that British Columbia charges, and near the midpoint of the $5-65/ton “social cost of carbon” price suggested by the White House.

Where do proceeds of carbon taxes go?
In most cases, as in British Columbia, carbon taxes are a “tax swap,” whereby other taxes — notably on income, capital, etc. — are reduced. Some bills, like that proposed by Citizens Climate Lobby, feature a “dividend,” or direct rebate back to taxpayers. Sometimes, climate actions are funded with a portion of proceeds as well; the Massachusetts bill, for instance, directs $90 million in revenue towards transportation debts and 10% to clean energy. In DC, ambitious plans have been launched, but not yet funded, for transit expansion (by WMATA and DC) and for cutting emissions, and a carbon tax would be one way of funding implementation of those plans. (Boulder’s tax was implemented to fund its climate action plan.) In addition, DC currently pays its annual operating subsidies for both WMATA ($275 million in FY2014: $58M bus, $42M rail, $22M paratransit) and DDOT transit out of general funds, and a carbon tax could be a stable, dedicated source of transit operating funds.

Who are winners and losers?
A carbon tax that includes electricity would have a much broader base and thus wider impact. It would primarily affect the office sector, and as such mostly commuters, but it might also attract Congressional attention. A carbon tax solely on fuels would mostly impact building heating/cooling; again, this would largely fall on offices, but also on DC residents’ heating bills.

Although a carbon tax typically is somewhat regressive, there are many ways to design a carbon tax to mitigate impacts on lower income consumers. In particular, a DC carbon tax could use targeted measures to offset higher home heating costs for low income residents: income tax credits, weatherization or LIHEAP assistance, and transit improvements.

Further reading
Sightline Institute: Carbon Tax Fact Sheet
Resources for the Future: Carbon Tax FAQs
Citizens Climate Lobby: DC Chapter

Chicago’s 1923 zoning ordinance

1940s Chicago skyline by Charles W. Cushman, from Indiana University

Lindsay Bayley asked via Twitter about Chicago zoning before the 1957 ordinance. I’d seen the city’s previous (and first) zoning ordinance, adopted in 1923, only as a library reference book, but I thought it was worth a look online. Sure enough, the Internet Archive offers up the entire document, including all 15 pages of text, hand-drawn maps of the entire city demarcated by use and bulk, and the few fantastic pages of extra-legal zoning envelope illustrations, sure to please the form-based coder in your family:

Chicago zoning envelope illustration, 1923

Even though the zoning ordinance was only in force for a scant six years until the Depression kiboshed construction, so much was built in those years that the bulk standards’ peculiar shapes are still visible throughout the city. Downtown, views really open up above the 264′ ceiling on “palazzo” tower heights, which could be exceeded only by thin spires — hence the two-tiered skyline seen above. In the neighborhoods, hewing closely to zoning’s origins as a means of guaranteeing light & air, larger lots and corner lots were allowed higher FAR and building volumes.

(I find it strange that the second of Chicago’s five bulk districts, circa 1923, was about as permissive as the zoning for present-day downtown D.C. And yet our own restrictive attitude towards height was based, strangely, on Chicago’s practices just one generation prior, in 1890.)

Where the Height Act came from

Photo at top of post is of Chicago skyline, perhaps 1958, by Charles W. Cushman, from Indiana University‘s collection

Can we definitively identify a trend yet?

even in Phoenix!

Even in many of the capitals of sprawl, the free market is clearly demonstrating that sprawl has fallen from favor. These regions may not be seeing a turning point, where suburban growth plateaus (not shrinks, since their overall regions continue to grow) and where urbanism begins to account for most growth, but they have reached their inflection point: when sprawl’s gallop slows down, and when cities stopped shrinking as quickly. This seems like a small point, but humans feel such changes. A roller coaster is always moving forward, but at vastly different speeds; the thrill comes from the G-forces applied when the acceleration increases or decreases.

What’s most interesting about these examples is that they’re not locations where transit accounts for a substantial share of local trips. Even in an era of flat energy prices and even in the absence of good alternatives, the market is choosing car-light locations (where people at least have the choice to drive less) over car-dependent locations.

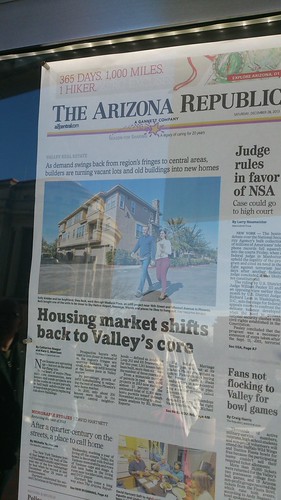
  • Phoenix: “In this down cycle, we were really trying to find some unique opportunities,” [David Kitnick, Rosewood Homes president] said. “After the collapse, you had to have a compelling reason to buy a new home. It didn’t make sense for us to just build more homes in suburbia. Those weren’t selling.” – Catherine Reagor and Kara G. Morrison writing in the Arizona Republic
  • New Jersey: Suburban office space has been ailing for some time as companies downsize, more employees work from home and much of the Millennial generation opts to live and work in urban cores with access to public transportation. New Jersey, where Mack-Cali has a strong focus, has been especially hurt by corporate downsizing, particularly in pharmaceuticals and telecommunications. “Companies are doing more with less, putting more people in lesser amounts of space,” Mr. Hersh said. “There’s still a need for office space. It’s just not what it was.” Analysts are more blunt. “Suburban office is probably one of the worst real-estate businesses there is,” said Michael Knott, a managing director with Green Street Advisors, a real-estate research firm. “We think apartments are a better market.” – Dawn Wotapka writing in the Wall Street Journal. On the other end of New Jersey, suburban Philadelphia’s largest publicly traded landlord is now also Center City’s largest: Brandywine Realty Trust’s 2013 growth strategy (from the 2012 annual report) is to “Increase urban, multimodal town center exposure; reduce commodity, suburban product.” Not only does that mean building office towers downtown (and largely exiting New Jersey), it also means retrofitting retail to make its existing suburban office compound in Radnor slightly more walkable.
  • Houston: The [Rice University Kinder Institute for Urban Research]’s annual survey of Houston-area residents last year found that half the residents of Harris County, of which Houston is part, would prefer to live “in an area with a mix of development, including homes, shops and restaurants” as opposed to a “single-family residential area.” Even if you look at the farthest parts of the metro region—the nine counties surrounding Harris County—more than 40 percent of residents prefer the mixed-use option… “the challenge today is not in finding residents who want to live in more compact, urbanized communities, but in building places across the region that can accommodate them.” – Ryan Holeywell writing in Governing
  • Atlanta: Metropolitan Atlanta, long a symbol of car-dependent American sprawl, has recently passed a threshold where a majority of its new construction spending is now focused in high-density, “walkable” parts of town… “[I]t’s a pretty significant sea change in how we build the country. The country’s going to look fundamentally different over the next generation than it has over the past two generations,” [says Chris Leinberger] – Emily Badger in The Atlantic Cities; in contrast, under-investing in walkable places suppresses future economic growth by making the metro area less efficient and less productive. In Streetsblog, Angie Schmitt notes that the same study found that the workers with the most choices seek out walkability: 27% of knowledge workers live on 0.88% of the region’s land area.

No subways for you, rowhouse neighborhoods

Nationals Park View
Maybe for these rowhouses, since they’re in a “Land Use Change Area.” Photo by Mr. T in DC.

Metro’s recently publicized 2040 plan for a new downtown loop line elicited a lot of consternation by many city residents, wondering why the new subway line hewed so closely to the existing downtown. The short answer is: because they won’t need new subways. It ultimately comes down to cost and benefit: new subway construction is so expensive that it can only serve the highest-density neighborhoods. Instead of a plan to connect every rowhouse in the city to a subway, it’s a plan to maximize capacity to and through the regional core at a minimal cost.

As Matt Johnson wrote in a recent GGW post, “Metro’s studies found little need for a new subways outside of downtown based on the expected travel patterns in and density of those areas in 2040.” Ben Ross clarifies in a follow-up: “Why isn’t Metro planning more rail lines inside the Beltway? One big reason is that political pressure and federal regulations require it and other transit agencies to look only at current zoning and master plans… This forecast, in practice, is prepared by cobbling together the master plans adopted by local governments, which are not anyone’s best guess of the future, but mostly reflect the desires of locally dominant political forces.”

WMATA’s staff echo this on their PlanItMetro blog: “Many of you have said that we missed or have asked why we don’t have a line to . As part of this plan, we have analyzed almost every corridor or mode that you have identified.”

A recent Cal study by Erick Guerra and Robert Cervero examined the cost-effectiveness of various rail transit extensions vs. the population and employment density of the areas served, and determined a cut-off aggregate density of 100 persons (residents and jobs) per acre as a cut-off for high-cost heavy rail:

Rail cost-effectiveness & density

In this region, per research from Terry Holzheimer at Arlington Economic Development (full PDF), only downtown D.C. and a handful of high-rise suburban centers surpass that threshold:

Gross land use intensities, 2007

Notably, though, the historic neighborhoods of Georgetown and Old Town — while surprisingly surpassing Edge Cities in intensity — fall well short of that density threshold. Laurence Aurbach calculated per-acre intensities for a few other historic neighborhoods, and of them only Dupont Circle [112.7] achieves downtown-level intensity, appropriate given that it’s chockablock with mid-rise office and hotel. Capitol Hill [44.8] and Logan Circle [57.1] also fall well short of 100 persons/acre.

The DC comprehensive plan gives precious little scope for other non-downtown areas within central DC to intensify much further. Nor do they seem to want intensification: DC neighbors will have a cow over one 6-story building one block from Metro. Contrast that to the 33-story apartment towers next to Metro in olde-timey Alexandria, 15-story office towers surrounding the Metro stations in mostly-rural Loudoun County, and heck, 40-story towers proposed along a Beverly Hills subway that’s at least ten years away. Those transit-supportive densities are impossible to build in the “neighborhood conservation areas” that comprise most of the District’s land area.

Meanwhile, the areas designated for “land use change” (in essence to be annexed to the mid-rise downtown) are NoMa and Capitol Riverfront. Connect those two neighborhoods to Union Station and Georgetown,* via bypasses of the Rosslyn and L’Enfant choke points, and add a few connecting points at the edges of downtown so that people can reach destinations like Union Station without going through Metro Center, and you’ve clearly defined WMATA’s proposed downtown loop subway.

DC comp plan policies map

Another instructive comparison to Paris might be in order: Washington, with its low density and low transit cost effectiveness, has 41 heavy rail stations and single-family rowhouses just one or two miles from the core, whereas Paris has flats stretching to the city limits, lower rail construction/operating costs, and almost 300 heavy rail stations within the city.

Of course, not all is lost, rowhouse neighborhoods! Note that light rail has much lower population density thresholds — and that DC has a plan for that.

* We can perhaps give Georgetown a pass, since the crowds of tourists visiting its shops don’t show up in either the resident or employee numbers.

All FARs are not created equal

At first glance, high-rise Arlington doesn’t seem to permit denser development than DC. The “C-O-Rosslyn” zoning permits a Floor to Area Ratio (FAR) of 10 — equal to the C-4 zoning that covers much of downtown DC, 6th to 19th and Pennsylvania to Massachusetts. A segment along the north side of Pennsylvania, 10th to 15th, is actually zoned for 12 FAR, due to its special 160′ exemption under the Height Act. (This is one of many nonsensical bits within the Height Act; other streets in downtown, like L’Enfant Plaza and the Southwest Freeway, are just as wide and thus in theory present equal opportunities, but their property owners apparently aren’t as well connected as those fine hotels along Penn.)

Yet FAR in DC goes much further than that in Arlington. Along DC avenues, rights of ways typically extend all the way to the building line; front yards are often within the right of way. For example, in Woodley Park, Connecticut Avenue is just 60′ wide — but sits within a generous 130′ right-of-way, which gives it sidewalks ample enough for ambling and dining. Rosslyn, on the other hand, developed rather more haphazardly, and many of its wide roads were widened using easements onto private property. Thus, the FAR granted to a parcel only can be built upon the fraction of the site that is actually buildable, and the same FAR yields much taller buildings. Take a look at the buildable area for 1300 Wilson, just to the left of the middle of this map:

Rosslyn property lines

Similarly, the new street network to be built through the large new developments at Tysons Corner will be built on easements through what’s now private property. Thus, the resulting FARs look low but result in fairly tall buildings. Fairfax’s implementation reports indicate that many of the developments approved or proposed at Tysons’ rail stations are in the range of 4-5 FAR. That’s about equivalent to DC’s C-3 zoning, which is what surrounds Dupont Circle, Judiciary Square, etc. (Yes, that’s substantially lower density than the C-4 in Metro Center, or the C-5 around Freedom Plaza.)

However, in both Arlington and D.C., the high density doesn’t extend very far. For now, most of the newer office areas at the edges of downtown (L’Enfant Plaza, Noma, West End, Navy Yard, Mt. Vernon Square) are zoned C-3-C, or a 6.5 FAR. (The forthcoming zoning rewrite proposes to remove FAR limits for these areas.)

Up-rising
The cloud-scraper in the middle is Living Shangri-La, at the time the tallest building in Vancouver.

By comparison, Living Shangri-La in Vancouver has an FAR of 13.41; most of the shiny new residential areas fringing its downtown have FARs of around 2-3; that’s roughly equivalent to the R-5 zoning around DuPont Circle. Same density in a radically different form. (It’s hard to compare these to other American cities, most of which are wildly overzoned; downtown Chicago starts at 12/16 FAR and goes way up from there; the Sears Tower was built as-of-right.)

The Silk Road’s detour to the Washington Channel

The first post in the watershed series mentioned that Morus alba (white mulberry) is a common invasive understory tree found at the edges of lawns along the Washington Channel, particularly along the unmown verge beside the fences that ring East Potomac Park’s recreation facilities. Given a chance, these shrubs will grow into a smallish tree of up to 15 meters, with a peculiar combination of lobed leaves on young shoots and heart-shaped leaves on older shoots. Its copious blackberry-looking fruits , which can disperse an estimated 20 million seeds per tree, make a convenient food source for birds and maybe humans — or else they leave a sticky purple mess on the walkways below.

But wait, mulberry? Isn’t that what silk is made from? How did that end up here?

White mulberry
What is this weed, and what does it have to do with the Opium Wars, Jefferson family wedding gowns, and deforestation in Ontario?

Silk production, or sericulture, was invented in China at least 4,000 years ago; legend says it was discovered by a princess who was strolling through the woods with a cup of hot tea. Young mulberry leaves are fed to silkworms, which spin silk threads around their cocoon as they metamorphose into moths. The cocoons are collected, boiled, and the threads are spun into fiber. China still accounts for most of the almost one million hectares (2.5 million acres) of mulberry under cultivation worldwide, according to the FAO, largely for silk but also for forage, wood, and even biofuel.

Yet sericulture (silk cultivation) requires that both mulberries and silkworms thrive in tandem. Mulberries obviously have adapted well enough to the local climate; thousands of years of domestication has selected for robust and easily grown varieties. The silkworms are a different story: they’ve been raised indoors for thousands of years, and thus have evolved into a very narrow ecosystem — they don’t even survive in the wild anymore, and require an exacting temperature range of 73-84° F, with high humidities, in order to thrive.

Silk was long one of the world’s most coveted agricultural products, and for centuries the world went to astonishing lengths to procure it from China.* Starting all the way back in Jamestown, Virginians attempted to get a cut of this lucrative trade by manufacturing silk: it seemed an ideal fit for the area’s warm climate and then-remote location, and potentially valuable both for the colonists and for British weavers. Yet while Virginia hews a bit closer to such temperatures than England, it isn’t exactly a room-temperature silkworm paradise. So while the robust mulberry thrived, fragile silkworms brought to Virginia didn’t, and instead Virginians profited off the native tobacco plant.

Mulberry Row

Thomas Jefferson’s family attempted silk cultivation at Monticello, and the results are telling. Above is “Mulberry Row,” the remnant of a lane lined with mulberry trees and, once upon a time, several buildings where slaves and other laborers did much of the work of the plantation. Obviously, the mulberry trees have done okay over the years — outlasting the buildings, for instance. The silkworms, though? Not so much. In 1811, Jefferson jokingly wrote to his granddaughter Cornelia,

your family of silk worms is reduced to a single individual that is now spinning his broach. to encourage Virginia and Mary to take care of it, I tell them that as soon as they can get wedding gowns from this spinner they shall be married. I propose the same to you that, in order to hasten it’s work, you may hasten home; for we all wish much to see you.

For what it’s worth, neither Mary nor Cornelia ever married, although I doubt her silkworm colony’s failure to generate enough silk for a wedding gown had much to do with that.

Silk was so valuable that Americans couldn’t be dissuaded by the industry’s failure in Virginia. Silkworms, as mentioned above, are fickle and highly adapted to the methods of Chinese sericulture; they feed almost exclusively on Morus alba, which as mentioned grows quite vigorously on Chinese farms. Eastern North America has a native variety of mulberry, Morus rubra, an understory plant suited to the area’s deep forests, but the silkworms rejected M. rubra feed.

Instead, colonists planted several Chinese mulberry varieties in hopes of keeping their silkworms happy. Colonial-era botanist William Bartram, in his travels through the South, noted dozens of instances of M. rubra but only one of M. alba trees — at a plantation near Beaufort, S.C. that was attempting sericulture (digitized book, pg. 308; location surmised between present-day Jacksonboro, S.C. and Savannah, Ga.). Later, Connecticut implemented various subsidy schemes, even including a cash bounty on planting Chinese mulberry varieties, and eventually succeeded at building a small silk industry in the 19th century.** (The Morus multicaulis mentioned in the Mansfield article is now recognized as a variety of M. alba.)

In the intervening centuries, the invasive M. alba has far outcompeted native M. rubra on its home turf: M. alba has spread much of the contiguous United States except for the desert Southwest, high plains, and taiga forest, and pushed M. rubra to endangerment in Connecticut, Massachusetts, and Ontario. Not only have widespread planting efforts like those in Connecticut spread M. alba far and wide, but it’s a tree that’s been honed by centuries of breeding for vigor, with a “high growth rate and great adaptability to adverse environments,” according to the Global Invasive Species Database: “M. alba and hybrids were evaluated to be consistently more fit than the native M. rubra in a laboratory study.” M. alba hybridizes with, and spreads root diseases, to M. rubra. Widespread deforestation and urbanization in eastern North America opened up countless opportunities for sun-loving, early-successional species like M. alba, while concomitantly destroying the deep shade that M. rubra adapted to.

* As a descendant of Cantonese merchants, perhaps I should be glad that these experiments failed? Oh, the complicated webs that history weaves for us!
** The mild success found in Connecticut indicates that perhaps it was less the climate, but Virginia’s lack of capital for indoor silkworm warms, that doomed the early industry.


This semester, I’m taking a Natural Resources class through Virginia Tech about understanding local watersheds, wherein I’ll be researching and posting knowledge about the Washington Channel. You can explore the other watersheds that my classmates are investigating over at the class blog’s page. Other posts in this series can be found using the tag watershed.

Washington Channel: more a conduit than a stream

While Washington Channel is known for its fishing, it’s not because it’s a particularly inviting habitat for fish species. Instead, its unique flow pattern of imported water make it a “trap” for fish swept upriver by the tides, and as such it sees fish species that aren’t typically found in other local waters — which, oddly, makes it popular among anglers.

Washington Channel & Tidal Basin at high tide

The most productive and diverse habitat in most waterways–the shorelines–are along the Washington Channel entirely armored with concrete. Beyond those concrete walls are monocultures — either more concrete or lawns, rather than on-shore wetlands. Between the walls, the constant scouring effect of the Channel’s twice-daily flush keeps the Channel relatively deep, so there are scant near-shore wetlands: the central channel is kept at least 9-14 feet deep for navigation purposes, but the entire channel ranges from 3-26′ deep. (The Tidal Basin is a bit more inviting to life, since it’s shallow [5-7′ throughout, average depth of 6.5 ft.] and a bit more placid.) The shallow-water ecosystems at the water’s edge, which combine sunlight, warmth, nutrients, and shelter, are largely absent along both. The Channel is, in effect, a concrete canyon.

DC Fire Rescue Boat and Army War College

This canyon isn’t very resilient, either; it can easily flood, as there’s nowhere for water to go when the river rises — or even for the wake from powerboats to do anything other than echo off the walls.

Washington Channel & Tidal Basin at high tide

The shore edge’s armor has started to degrade, though: a combination of higher water levels, subsidence by the marshy soil, inevitable concrete failure, and erosion means that some areas behind the seawall are now almost permanently wet. Some wetland species might start to colonize these damp pockets, although lawnmowers will probably thwart their progress.

Some of the shallower parts of the Washington Channel have demonstrated potential as rich habitat, though. A stretch of older seawall along Fort McNair, beginning in a small lee behind the Titanic Memorial, is a comparative haven for aquatic vegetation and fish. At one point, there was a 10-20′ wide band of submerged aquatic vegetation (SAV) off the fort’s shore — which, according to the NOAA navigation charts, is the shallowest part of the Channel at just 2-5′ deep. These underwater meadows provide valuable fish habitat, particularly for anadromous (half-ocean, half-estuary) species that spawn there before returning to the saltwater estuary downstream.

Even as Potomac River water quality has improved, habitat quality in Washington Channel remains poor. The quantity of SAV (much of it invasive hydrilla, which was still better than nothing) grew substantially in the 1990s, alongside large fish populations.

ecosystem health Wash Channel

Sadly, major rains throughout 2003 — when the Potomac carried more than 3X as much water as in the drier years 1999-2002, and twice its annual average (MWCOG/VT PDF, pg. 32-33*) — led to severe sediment and nutrient overload throughout the Potomac ecosystem, and thus to large algae blooms in 2004. These two years’ trials devastated established SAV in the upper Potomac estuary, including in Washington Channel, and so far neither plant nor animal life seems to have recovered.

Second chances: improving habitat in channelized waterways

While the Washington Channel may be the local champion for having the least natural stream banks, it’s sadly far from the only such watershed nationally. Perhaps the worst example of an “imprisoned river” is the Los Angeles River, almost all of whose banks were paved back in 1938.

Yet nature does abhor a vacuum, and so if you provide adequate habitat (as the Channel did for those few lovely years around 2000), an ecosystem will soon blossom. In Chicago, the Friends of the Chicago River built a “floating fish hotel” to provide a smidgen of near-shore-wetland habitat within downtown’s urban canyon, and plans to significantly expand upon this experiment in the near future.

* Incidentally, to update something I wrote earlier about Western and Eastern water systems, the Colorado River’s pre-diversion annual flow was 50% larger than the Potomac’s average flow (at Little Falls) today. It would rank among the largest Eastern rivers, like the Hudson or Susquehanna. This great map from the Pacific Institute clearly shows my earlier point: the East is well-watered indeed.

** 2018 update: a SAV planting program has succeeded in dramatically increasing SAV in the upper Potomac estuary since 2013, and in increasing juvenile bass populations. Floating “fish hotels” have been added next to the 7th St. “recreation” pier at the Wharf.


This semester, I’m taking a Natural Resources class through Virginia Tech about understanding local watersheds, wherein I’ll be researching and posting knowledge about the Washington Channel. You can explore the other watersheds that my classmates are investigating over at the class blog’s page. Other posts in this series can be found using the tag watershed.

Fresh policies will freshen the flow into the Washington Channel

Yesterday, I wrote about the numerous storm drains that currently dump polluted water directly into Washington Channel. The District of Columbia recently adopted some of the nation’s most stringent and innovative rainwater policies, and the Washington Channel watershed stands to significantly benefit as plans and projects adapt to these new policies and incorporate state-of-the-art practices in green infrastructure (GI). The Natural Resources Defense Council’s “Rooftops to Rivers” report give DC’s new policies a high rank (just behind Philadelphia) among their “Emerald City Criteria” for river-friendly municipal policies.

Canal Park's fountain & rain garden
The new Washington Canal Park, just a few blocks east of the Washington Channel watershed, recycles stormwater not just for its site but also for three neighboring developments.

The impetus for these changes came from the 2011 renewal of DC’s “MS4 permit,” the EPA permit for the storm drains that drain the urbanized part of the Washington Channel watershed (and 2/3 of the District), and is managed by the District Department of Environment (DDOE). As part of this process, DC has adopted a completely new set of stormwater regulations with three key innovations:

  • a DDOE impervious surface charge to generate revenue for municipal green infrastructure, encourage existing buildings to reduce impervious cover, and reward “RiverSmart” properties (this is separate from DC Water’s impervious surface charge)
  • a retention standard that requires new buildings to retain 1.2″ of rainfall on site (~90% of all rain events), and renovations to retain 0.8″ on site
  • a credit trading scheme, the first in the country, giving the retention standard flexibility for dense downtown developments, rewarding efforts that go beyond, and generating funds for comparatively inexpensive GI improvements in the neighborhoods like Canal Park. By taxing bad things, like water pollution, you create an economic incentive to create good things, like neighborhood parks. (In DC, this creates a tidy way to “tax” federal offices through utility fees, and then build neighborhood parks.)

Although DDOE expects only 1% of the city to annually be affected by the retention mandate, that’s still 10X the area currently affected each year by voluntary green infrastructure efforts.

While this change in stormwater regulations is currently only tied to the separated storm drain permit managed by DDOE, DC Water hopes that these efforts will be able to have an appreciable impact on its troublesome combined sewer system. If so, DC Water may be able to renegotiate an existing EPA mandate requiring billions of dollars in new “deep tunnel” pipes (see pg. 7 of this Brookings report).

These just-implemented policy changes are already shaping up to have a positive impact on the Washington Channel watershed, where much of the urban fabric will change in coming years.

  • The Southwest EcoDistrict, a plan currently under development (primarily by the federal National Capital Planning Commission, with ZGF Architects) for the redevelopment of several blocks of mostly federal offices centered around 10th & D Streets SW, plans a truly cutting-edge water management scheme. The overarching goal is to reduce water use by 70% even while increasing the number of people on the site. Pages 11-29 of the May 2013 PowerPoint featured on their website goes into great detail about the strategies that the EcoDistrict can employ towards that goal: treating both greywater and air conditioning condensate water for potable use, storing a 1.7″ rain event in a truly vast cistern hidden underneath an existing bridge, and (by going beyond the 1.2″ mandate) receiving stormwater credits from other developments.
  • Over half of the Washington Channel’s urban frontage (over six blocks) is included within plans for the Wharf, a proposal to completely transform the Channel’s shoreline. The development embraces the Channel with a new riverwalk and several public piers that will bring the public down to the Channel’s water — very different than today’s gated-marina frontage. Complying with DC’s 1.2″ retention standard earns the Wharf the maximum number of LEED-ND points possible under the stormwater management credit, helping it achieve its LEED-ND Gold rating. Among the innovative strategies planned: using stormwater as process water within an on-site combined heat & power (cogeneration) facility that improves both energy efficiency and reliability.
  • Recent construction underneath the National Mall, part of which is within the Tidal Basin watershed, not only rebuilt the severely compacted turf but also included 500,000 gallons of rainwater storage in two cisterns — probably the city’s largest such installation. The Park Service plans another two cisterns as part of further Mall turf renovation, to store water running off the Mall (no, compacted turf doesn’t really do a great job of absorbing rain) and its drives for future irrigation uses. These cisterns could be just the start: in 2011, NCPC studied a two-block-long cistern, the entire width of the Mall, to store 20,000,000 gallons — enough to handle a 100-year rain event, and hopefully prevent the Federal Triangle from flooding again.
  • Stormwater fees are also having an impact on a smaller scale. My own apartment building near the Washington Channel, built during the concrete-happy 1960s, has just embarked upon an aggressive program to replace paved surfaces — open roof, impermeable walkways and driveways — with green or permeable surfaces. This long-overdue plan was put into motion due to the new impervious surface charge.

In the future, big storms like tonight’s (but not quite so big) might actually improve the Washington Channel’s water quality, instead of harm it. Later: a look at the Washington Channel’s water chemistry, plus what that means for future evaluation of the channel. But tomorrow, I’ll look at how the physical form of the Channel shapes habitats along, and within it.


This semester, I’m taking a Natural Resources class through Virginia Tech about understanding local watersheds, wherein I’ll be researching and posting knowledge about the Washington Channel. You can explore the other watersheds that my classmates are investigating over at the class blog’s page. Other posts in this series can be found using the tag watershed.

The rain falls upon this plain, but then what?

Washington Monument in a different reflecting pool

As I mentioned in previous posts, the Washington Channel is quite unique in that the water contained within it has little to do with its drainage basin: instead, its water is essentially imported from downstream via the tidal cycle. As such, its water quality (unlike almost all other waterways) largely does not reflect the land and water context adjacent to it. In addition, the Channel benefits from being entirely within the District of Columbia: the federal government has long held title over the waters (Morris vs. United States), and used parkland to create and frame the Basin and Channel. As a result of that unique context, not only does parkland surround all of the Tidal Basin and most of the Washington Channel, but the surface waters are also under federal protection.

Tidal Basin & Washington Channel hydrological maps

The Tidal Basin and Washington Channel do receive surface and groundwater runoff from their immediate areas, which together add up to 1.412 square miles of the District. The Tidal Basin drains 0.423 sq. mi., of which 0.169 sq. mi. (almost 40%) is surface water. 43% of the watershed is parklands and grass areas, including parts of the National Mall, the monuments ringing the Basin, and even the small hill underneath the Washington Monument.

Tidal Basin & Washington Channel hydrological maps

The Washington Channel drains 0.989 sq. mi., of which 0.3 sq. mi. (25%) is surface water. As its north bank is heavily developed, 53% of its watershed includes urban development, and the remaining 22% is parkland.

DC’s largest water pollution problem is its combined sewer/stormwater system, or “CSO.” (I’ll write more on these systems in later posts; they’re super-important for understanding urban water quality but not entirely relevant to this post.) This system, which is responsible for dumping a toxic brew of sewage and rainwater directly into many local waterways, drains one-third of the city, including most areas built before World War 2. However, since the immediate environs of the Tidal Basin and Washington Channel were redeveloped in a somewhat recent era, they have separate sewer and stormwater systems. This map shows the large parts of the city which have combined sewers — many of which, incidentally, are named after the creeks that they replaced:

Instead, smaller, separated storm drain systems — nine along the Channel and three along the Basin, delineated by the faint lines running roughly perpendicular to the water on the map below — intercept rainwater that falls on Southwest Washington’s roofs and streets, and dumps that untreated water into either the Tidal Basin (light blue on this map) or the Washington Channel (tan on this map):

Tidal Basin & Washington Channel hydrological maps

As you can see by comparing the first and last maps, the inland boundaries of the two watersheds are defined by these artificial drainages rather than the natural contour lines seen in the first map. If you look in the vicinity of N and O Streets SW, for instance, you’ll see that there’s a valley roughly between Third Street and Half Street. Historic maps show this as what was James Creek, which drained pretty much due south to the Anacostia River, but instead these blocks now drain “uphill” to the Potomac to the west.

The storm drains dump unfiltered water, often contaminated with urban pollutants, directly into the Basin and Channel. This contributes substantially to the substantial water quality problems within these two water bodies, but plans are underway to substantially reduce the quantity of these flows in the near future.

Sources for this post, notably the maps and geographic analysis of watersheds, include the DC Department of Environment’s water quality standards documents, which I’ll report on in greater detail in an upcoming post.


This semester, I’m taking a Natural Resources class through Virginia Tech about understanding local watersheds, wherein I’ll be researching and posting knowledge about the Washington Channel. You can explore the other watersheds that my classmates are investigating over at the class blog’s page. Other posts in this series can be found using the tag watershed.

One vision for a Southwest DC that could have been

Arthur Goodwillie’s proposal for retaining the rowhouse fabric and infilling block interiors with courtyard apartments was rejected, not really due to cost but primarily due to complexity. Instead, the federal government built garden apartments in places like Arlington (WAMU story; NR nomination [PDF])

Goodwillie Plan for SW: contrast existing and proposed

[More images: closer look at redevelopment scheme | closer look at existing conditions survey | existing structures for entire Southwest neighborhood | historical material about the Capitol Park redevelopment project subsequently built on the site in question, courtesy CP II Condominium Association]

The following excerpts are from “The rehabilitation of Southwest Washington as a war housing measure : a memorandum to the Federal Home Loan Bank Board,” by Arthur Goodwillie, January 2, 1942 [LOC catalog record], a never-implemented plan for selective demolition and infill in the area subsequently cleared and redeveloped as Capitol Park. For further background, I recommend Christian James’ website about the redevelopment and Studio 27’s presentation (& book).

(Pg. 7.) The war effort should be so organized as to avoid unnecessary damage to the important peace-time values which in part — it must be remembered — we are seeking to defend. If it can be carried forward so that subordinate but highly important economic and social values will also flow from it — as by-products — then failure so to develop it is both shortsighted and indefensible.

The production of standard war housing in areas where only obsolete structures and vacant city lots now exist, as recommended in this memorandum, will also (a) eliminate — without direct cost — large slum and blighted areas; (b) restore value to much substandard Class “B” residential real estate; (c) lessen the post-war impact of new war housing on Class “B” property value and mortgage security; (d) reduce the volume of uneconomic suburban development and the costly duplication of schools, streets, utilities, etc.; (e) help stabilize the declining municipal tax base and put to productive use much unproductive, municipally owned real estate, acquired through the enforcement of tax liens; (f) provide local housing authorities with many units to offer as “equivalent elimination”; and (g) set up a large reserve of standard but low cost housing, for post-war rental to low income families, at rent levels that will reflect little or no subsidy.

(Pg. 16-19.) The population is relatively stable. A study made some years ago among white residents of Southwest Washington developed the fact that of the 10,658 persons interviewed, 9981 wanted to continue living there. The recently completed nine block Bank Board survey, on which the following report is based, showed that about 80% of the negro population has lived in the district for 5 or more years.

Present construction within the Area consists largely of two story, brick, row houses, two and three rooms deep, among which is interspersed a smaller number of frame structures of the same general type.

HOUSING PROBLEM
Although it extends to within three blocks of the Capitol of the United States, structural, economic and social conditions in the Area are shameful. Though basically sound, the brick structures of the post Civil War period are almost uniformly substandard… Interspersed among these brick dwellings is a considerable number of older frame houses. The latter are in a lamentable state of repair, dangerous, unhealthful, vermin and rat infested. They constitute a serious fire, safety and health hazard and should be demolished, as a slum clearance measure, at an early date.

Block interiors contain over 300 substandard alley dwellings, or are used as storage spaces for the miscellaneous accumulations of an indigent population. Moral and health conditions in many of these insanitary, unheated houses are deplorable. Fortunately, their use for residential purposes after 1944 is prohibited by law.

The Area, however, has many valuable assets. Were modern housing available, it would be an ideal residential location for the tens of thousands of persons who are employed in adjacent governmental Establishments, Departments and Agencies.

Streets are wide and well shaded. Water, light and sewer mains, sidewalks and pavements are in place, paid for and well maintained. Side by side with decrepit frame structures are some 2900 substandard but basically sound brick buildings, usually in rows, virtually all of which can be saved and are well worth saving. Vacant perimeter lots, vacant block interiors and land on which now stand decrepit frame structures, which should be demolished as a slum clearance measure, provide sites for an additional 5000 dwelling units. This is a total of about 8000 units for the Area, without over-crowding.*

Block interiors are unusually large and offer a unique opportunity for development as open green commons and play spaces, abutting on the new construction referred to above. Along the entire western margin of Southwest Washington is the recently developed Washington Channel waterfront. [Adequate schools, settlement houses, and churches.]

An exceedingly difficult questions which now confronts most established residential communities — whether they are depressed or not — is how to supply necessary large additions to available neighborhood recreation spaces. Adequate park provisions is not a problem in Southwest Washington, since the “Canal Reservation,” a public park which will provide ample playground facilities for the adjacent residential section, lies along the entire eastern border of the Area. Because it occupies a wedge-shaped tract between the Pennsylvania Railroad and Washington Channel, through traffic problems are also virtually non-existent.

The statement that there is a dangerously increasing housing shortage in Washington will be accepted without debate…

Pg. 53. The considerable saving in site cost [due to the low cost of land in Project block interiors] has all been allocated to new construction. If, as seems equitable, it were prorated between (a) the cost of projected new dwelling units and (b) the cost of rehabilitated units — the the over-all cost for reconditioned structures would be reduced to $725 per room** or to about 54% of that for new construction in similar areas elsewhere.

* In 2000, the Census counted 7,487 dwelling units in a comparable area, post-redevelopment, although with more office employment areas.
** emphasis in original

N & Union Streets

Shorts: movements

Striding

1. Susan Silberberg et al (via Angie at Streetsblog write that placemaking’s true value stems less from physical transformation than social transformation: “The act of advocating for change, questioning regulations, finding funding, and mobilizing others to contribute their voices engages communities.”

In short, it’s not about the bike, or the parklet: it’s about creating social space for a social movement to free now-privatized but publicly-controlled spaces, returning them to public use.

Years ago, this was a key (and under-appreciated) accomplishment of early Critical Mass rides. The event is just a means to an end, a safe space through which a social movement organized; to this day*, many confuse those ends and means.

* it’s arguably lost its urgency now that there are many other organizing venues.

not a maglev

2. There have been a few proposals to build maglev trains in the USA before, including this cross-Maryland proposal ten years ago. So what’s different about the latest version?

In a meeting with President Obama last winter, Mr. Abe offered to provide the maglev guideway and propulsion system free for the first portion of the line, linking Washington and Baltimore via Baltimore-Washington International Airport, a distance of about 40 miles. – Eric Pfanner, NYT

Those previous plans, however, did not feature Abenomics and its tidal wave of printed yen. As much as I’m skeptical of proprietary technologies, a fast and efficient connection between the two cities would certainly be momentous.

3. Thad Hall from the University of Utah (via Washington Monthly & Mischiefs of Faction) graphically shows how the House GOP has marched rightward, using DW-NOMINATE data:

The 50th-percentile average Republican in 1995 (104th Congress) — the red bar — was as conservative as today’s “RINO” moderate. Meanwhile, 1995’s firebrand 90th-percentile revolutionaries (the blue bar) then are *below* average now. The entire bell curve has shifted.