Recently: winning the war on sprawl, over-preservation, office to residential, shared streets, tax bill

I’ve recently published several articles over at GGWash.

  • Sprawl is slowing, but that doesn’t have to mean higher housing prices.” The downtown high-rises under construction only tell half the story of Greater Washington’s housing growth story. While all those cranes are easy to see from afar, what isn’t immediately apparent from the airport (but might be from a plane) is that many fewer acres of the countryside around us are being bulldozed for subdivisions–which for the past century has been where most lower-cost, low-rise housing was built. As a result, the region as a whole isn’t building enough housing for our rising population… Not only is supply overall not keeping pace with demand, but a large fraction of the new supply is in the housing market’s priciest segment: expensive high-rise construction, on expensive downtown land.
  • DC has more historic buildings than Boston, Chicago, and Philadelphia combined. Why?” Nearly one in five properties in DC are protected by local historic designation laws. DC is so prolific at handing out historic designations that we have more historic properties than the cities of Boston, Chicago, and Philadelphia combined, which together have almost eight times as many properties as DC. While this policy has ensured harmonious architecture across much of central Washington, it also means that Washingtonians are much more likely than residents of other cities to have their construction plans delayed or denied on subjective grounds by a historic review board.
  • Historic preservation in DC saves the loudest neighbors, not the finest buildings.” DC’s surfeit of historic structures results from several factors, notably the broad application of rather vague criteria for designation. As Roger Lewis has written, “the HPRB decision is inevitably a judgment call because much of the evidence for historic designation is inherently subjective.” Since every resident “squeaky wheel” is invited to request historic designation for just about any site in the District, many do — and overwhelmingly, they succeed.
  • DC’s countless thirtysomething office buildings stare down mid-life crises.” No other region can match Greater Washington’s density of 1980s and 1990s office buildings — we built over a million cubicles’ worth, almost as many as in the much-larger New York and Los Angeles regions. Now, these buildings are facing mid-life crises; many require substantial additional investment, as key building systems (like air-conditioning, plumbing, elevators, and roofs) require overhaul or replacement, just as the office market has changed.
  • Not every obsolete office building is cut out to become apartments.” Some, but not all, of these old offices can become residences, depending on their location, price, and layout. Despite considerable media coverage, office conversion has been comparatively limited in greater Washington for a variety of reasons, including a relatively healthier office market and a lack of specific incentives for the practice. Residential conversion offers some promise, but will not be a panacea for either the over-supply of offices, or the under-supply of affordable homes, because not every obsolete office building can be converted to housing.
  • Metro needs a loop to lasso riders from this growing corner of DC.” The way the District is growing is creating another rail bottleneck on the other side of town that will have to be addressed in the future. The Capitol Riverfront is easily the fastest-growing part of DC right now, and by some accounts one of the fastest-growing neighborhoods in America. If all 11,978 new housing units proposed within the Capitol Riverfront get built, the area around Navy Yard station would have the largest household population of any Metro station. Metro’s ridership forecasts, which now factor in development proposals, foresee that the area’s rapid growth might require additional investments, like a new subway line.
  • How are the Wharf’s shared spaces working out?” When the Wharf opened last month, it instantly became the largest expanse of “shared space” streets in the country. Over the past few weeks, it seems like these streets are largely working as they were designed. Even though a few of our commenters were skeptical about whether the approach would work here, so far there haven’t been any major complaints or adjustments needed.
  • The GOP tax plan would make housing and infrastructure more expensive.” Eliminating Private Activity Bonds and New Markets Tax Credits, as the House GOP’s tax code overhaul proposes, would have deep ramifications for funding infrastructure and affordable homes in the region.
  • The latest Republican tax bill changes commuter benefits, but probably not yours.” Tax law will only indirectly affect most area commuters.
  • Added 26 January: “A bold California bill would ease transit oriented development. How would a similar approach affect DC?” A bill recently introduced into the California legislature boldly proposes that every transit corridor in the state be rezoned to permit mid-rise apartments. In Slate, Henry Grabar writes that it’s “just about the most radical attack on California’s [housing] affordability crisis you could imagine.” In the Boston Globe, Dante Ramos writes “the bill may be the biggest environmental boon, the best job creator, and the greatest strike against inequality that anyone’s proposed in the United States in decades.”


Q&A about DC’s gas tax

Nature's fuel

Who wouldn’t be happy about Mother Nature’s Fuel?

How is DC’s current gas tax computed?

It’s 8% on the wholesale price per gallon… with a floor of $2.94, so that the revenue doesn’t drop below the prior rate of $0.235 per gallon. Since 2015, the gas tax rate has been at that floor.

It’s levied at the same rate on a variety of fuels, including ” including gasoline, diesel fuel, benzol, benzene, naphtha, kerosene, heating oils, [and] all liquified petroleum gases.”

Why did DC change how its gas tax is computed?

Here’s some background from DCFPI about why that changed. Maryland and Virginia also shifted to a percentage basis around the same time.

When did the gas tax computation change?

It was Phil Mendelson’s idea, and it was implemented rather quickly:
– May 21, 2013 headline in the Post: “D.C. council chairman seeks shift in collecting fuel taxes.”
– May 22, 2013 headline: “D.C. Council agrees to scrap per-gallon gas tax in favor of levy on wholesale fuel.”

How else could the gas tax be computed?

Here’s one goofy idea: Burning a gallon of gas produces 19.64 pounds of carbon dioxide. One could thus levy “a motor fuels tax of $0.0133 per pound of carbon dioxide emissions that result from the fuel’s combustion,” which would result in a tax of:
– $0.235/gallon for gasoline with 10% ethanol (the usual mix around here)
– $0.261/gallon for pure gasoline (usually only sold as marine fuel around here)
– $0.298/gallon for pure diesel
– $0.276/gallon for pure biodiesel
Doing so would technically put a “carbon tax” on the books without appreciably raising existing tax rates, and providing a very small incentive for biofuels.

Of course, a recalculation is also an opportunity to harmonize rates with a neighboring jurisdiction… see below.

(Interesting fact: British Columbia applies its carbon tax to fuels on a per-liter basis.)

How does DC’s gas tax rate compare to its neighbors’?

Maryland’s current rate is equivalent to $0.335 per gallon. (Yes, that’s $0.10 higher than DC’s.) Virginia’s current rate is $0.162.

How might DC gas station owners react to an increased gas tax?

You’ll have to ask them, but I was struck by this passage in a 2011 CityPaper profile (by Christine McDonald) of Joe Mamo, who owns nearly half of DC’s gas stations:

“We are really a real estate company,” he says. “We’re in it for the real estate.” Mamo considers the coming transition inevitable, given the high cost of D.C. real estate and predictions about “peak oil,” alternative fuels, and electric cars that might eventually make gas stations obsolete. “Long term, the real estate is where the value is,” he says.

Open letters

I’m not about to fall into the essentialist trap and say that “drivers here are obviously different,” but I don’t remember having to watch out for sudden U-turns before biking in traffic in DC. Sometimes, I see a few sudden U-turns within the span of traveling just a few blocks. I’ve long thought that U-turns are best avoided (better to just go around the block); evidently this is a locally learned behavior, as local laws vary.


A letter sent to Council in December in response to a CSG action alert:

I’m writing to urge you to support DDOT’s plans to launch a Performance Parking trial program in the Gallery Place-Chinatown-Penn Quarter area, adding to the three successful trial areas that already exist in Columbia Heights, the Ballpark District, and the H Street NE Corridor.

By way of introduction, I am a researcher and writer on urban planning topics who has had articles published by journals like the prestigious Transportation Research Record. I am also a frequent visitor to the Gallery Place-Chinatown area — it’s the nearest retail center to my DC home and since I volunteer at one of the area’s museums. Not only that, but three generations of my family have called DC Chinatown home, and my family continues to gather in Chinatown for special occasions. I have also used had the pleasure of using Performance Parking in four cities — Los Angeles, Pasadena, San Francisco, and, yes, the District of Columbia (around Nationals Stadium). My experience has been uniformly excellent across the board.

Results from these cities are unanimously clear, and unanimously positive:
– Lower prices for parking on average
– More customers
– Less time wasted in traffic
– Less traffic from those circling for parking
– Fewer distracted drivers and safer streets
– Less double-parking, and thus less congestion
– Fewer aggravating parking tickets
– Less pollution

Sadly, the news media has widely parroted fear-mongering lies about this program, spread by non-resident lobbyists for suburban commuters. These falsehoods focus almost entirely on the absolute highest possible price for parking — a price that will only be charged in a small subarea, for a small fraction of the available time. This price will absolutely not the vast majority of times and places. In particular, the peak rate will not affect people like nighttime workers who are traveling at off-peak hours and for whom driving may be the most reasonable mode choice. Perhaps most absurdly, these lobbyists appear to be completely unaware that Performance Parking already works very well here in the District, and over its seven years of existence has not resulted in any of the nightmarish scenarios that the media has seized upon.

For the small percentage of occasions when this peak rate will apply, the rate really is not at all noteworthy. Nationals fans already pay $8 an hour for metered parking during games, and it’s only fair that Capitals and Wizards fans do the same. Meanwhile, private lots within this area charge an average of $16 for one hour of parking during weekdays, and up to $51 an hour for special events.

Again, I urge you to expand the already-successful Performance Parking scheme to new parts of D.C. Thank you for your time and consideration.


Adapted from a 311 service request filed today.

I am writing to call your attention to a dangerous, but very easily and cheaply fixed, intersection: where the northbound exit ramp from 14th Street SW (US 1) intersects with eastbound Maine Avenue, SW.

Right turns on red are already banned at this intersection, since structures make it impossible to see around either corner. Such turns present an extreme danger to pedestrians and bicyclists proceeding northwest on the Anacostia River Trail (on the Maine Avenue sidewalk here); they would be approaching from the right on a green light.

This intersection already has three different signs that alert drivers to this particular danger:
– NO TURN ON RED under the right signal
– WATCH FOR PEDESTRIANS AND BICYCLISTS APPROACHING ON YOUR RIGHT mounted to the left
– [Bicycle] XING 250 FEET further up the ramp
Regardless, I often see drivers attempt, or make, right turns on red here. This is especially a problem at night, when the three glowing red lights overshadow the unlit signs.

The simple fix that I’m requesting is that the red-ball signal lights be modified to show red-arrows instead. All three of the green lights at this intersection show arrow signals, indicating that the way is clear to make a right turn on green. However, none of the red lights are outfitted with the same $20 arrow inserts.

Running no turn on red, Maine Ave SW

Adding the inserts would make it absolutely clear to drivers, day or night, that right turns cannot be made on a red light. DCMR 2103.8 stipulates that a “steady red arrow” signal does not permit a right turn on red under any circumstance. Nor does the intersection permit any other movement except a right turn.

Your prompt consideration of this matter would be much appreciated.

Running no turn on red, Maine Ave SW

Car driver running a red light at high speed, cutting off a cyclist who clearly has right of way and must suddenly stop

Telematics can reinforce centralization

Self-valeting vehicles would make going downtown a lot cheaper and easier. Photo: Steven Vance

1. Telecommuting is great, but only to a point. According to Gallup, “the ability to work remotely corresponds with higher engagement, but primarily among those who spend less than 20% of their total working time doing so.” Employees who spent more than 50% of their time working remotely had engagement and disengagement figures similar to those who never worked remotely. (The release also has some nice quotes from Vint Cerf at Google about the value of face-to-face interaction, and how they’ve sought to increase collaboration within the workplace.)

2. On a similar note about the potential of telematics, there’s a lot of hype out there about autonomous vehicles, aka driverless cars, but Nat Bottigheimer and my former colleague Brooks Rainwater have appropriately measured responses.

In the few conversations I’ve had with transportation professionals about their impact, their understanding is similarly muted. Yes, platoons of autonomous vehicles will squeeze a little bit more capacity out of existing roads while maintaining laminar flow, but it’s not as if there’s scads of peak-hour capacity remaining to be had.

The really big impact will be upon parking. By removing the cost and hassle of parking at the final destination could make urban centers even more valuable, and further diminish the primary appeal of drivable (really, parkable) suburbia — which is that it’s easy to drive to, and park at. If both of those factors become immaterial, then why bother driving to the B-mall when you could go straight to the A-mall, or downtown?

Similarly, an interesting class divide could arise if the vehicles really do succeed in eliminating driver-error crashes. Such crashes could soon become stigmatized as something that only happens to poor people who can’t afford fancy crash-avoidance technology. (Do people today cluck-cluck with resignation about people maimed in car crashes because the inexpensive cars said victims bought used were not equipped with adequate airbags?)

How would a carbon tax affect DC?

Nature's fuel

The right thing in climate policy for all the big countries is a carbon tax, which is simpler and less vulnerable to fluctuations in emissions than cap-and-trade schemes.” – The Economist

A recent discussion spawned the idea of implementing a carbon tax within DC, and so I wrote up this brief.

What and whom would a carbon tax affect?
A carbon tax, technically a tax upon the carbon content of energy and fuels, would primarily affect electric generation, gasoline & diesel, and heating fuels (natural gas, fuel oil). A narrower tax could affect only fuels, or electricity. The UK’s carbon tax, for instance, taxes various energy sources at differing rates.

Who consumes energy in D.C., and how?
The EIA reports that DC’s total energy consumption is 70.5% imported electricity, 18.7% natural gas, 7.9% gasoline, and 2.7%fuel oil. 66.3% of energy is consumed by the commercial sector (i.e., offices), 19.9% by residences, 12.1% by transportation (i.e., cars & trucks), and 1.6% by industry.

Of carbon emissions within DC proper in 2010, natural gas was 54.6% and petroleum 45.2%. Because DC imports all of its electricity, it has the least carbon intense economy among the states, emitting 91.6% less CO2 per dollar of GDP than the US average. This does not, however, include fuel burned for electricity used by DC end users; 59.2% of DC electricity originated from fossil fuel generators.

Have carbon taxes been implemented elsewhere?
Yes, several jurisdictions have. Finland and Sweden were first, in 1990 and 1991. In North America, the provinces of British Columbia and Quebec have carbon taxes, as does the city of Boulder (on electricity only). Dozens of multinational corporations, including most oil majors, use an “internal carbon price” to evaluate corporate decisions: ExxonMobil’s is $60/ton.

How have these fared?
British Columbia’s carbon tax, unique in its broad reach even though the province works within the framework of a high-carbon-emitting country, “has been remarkably effective in reducing fuel use, with no apparent adverse impact on the province’s economy,” according to a University of Ottawa study. GDP growth paralleled Canada’s, income tax rates fell to the lowest nationwide, and fuel consumption fell by 17.4% per capita.

Have carbon taxes been proposed in U.S. states?
A bill has been introduced in the Massachusetts legislature, and a ballot measure is currently collecting signatures. In Washington state, Governor Jay Inslee has specifically directed a legislative commission to study a carbon tax, and an NGO has proposed draft legislation.

What level of tax would be appropriate?
An easy guideline for measuring the impact of a carbon tax is that a tax of $1 per ton of CO2 results in just less than 1¢ in tax per gallon of gasoline. DC’s current gas tax rate of 23.5¢ per gallon thus implies a tax rate of $27.98/ton of carbon dioxide. (Maryland’s gas tax is now 32.10¢ per gallon.) This rate is very similar to the C$30/ton that British Columbia charges, and near the midpoint of the $5-65/ton “social cost of carbon” price suggested by the White House.

Where do proceeds of carbon taxes go?
In most cases, as in British Columbia, carbon taxes are a “tax swap,” whereby other taxes — notably on income, capital, etc. — are reduced. Some bills, like that proposed by Citizens Climate Lobby, feature a “dividend,” or direct rebate back to taxpayers. Sometimes, climate actions are funded with a portion of proceeds as well; the Massachusetts bill, for instance, directs $90 million in revenue towards transportation debts and 10% to clean energy. In DC, ambitious plans have been launched, but not yet funded, for transit expansion (by WMATA and DC) and for cutting emissions, and a carbon tax would be one way of funding implementation of those plans. (Boulder’s tax was implemented to fund its climate action plan.) In addition, DC currently pays its annual operating subsidies for both WMATA ($275 million in FY2014: $58M bus, $42M rail, $22M paratransit) and DDOT transit out of general funds, and a carbon tax could be a stable, dedicated source of transit operating funds.

Who are winners and losers?
A carbon tax that includes electricity would have a much broader base and thus wider impact. It would primarily affect the office sector, and as such mostly commuters, but it might also attract Congressional attention. A carbon tax solely on fuels would mostly impact building heating/cooling; again, this would largely fall on offices, but also on DC residents’ heating bills.

Although a carbon tax typically is somewhat regressive, there are many ways to design a carbon tax to mitigate impacts on lower income consumers. In particular, a DC carbon tax could use targeted measures to offset higher home heating costs for low income residents: income tax credits, weatherization or LIHEAP assistance, and transit improvements.

Further reading
Sightline Institute: Carbon Tax Fact Sheet
Resources for the Future: Carbon Tax FAQs
Citizens Climate Lobby: DC Chapter

In favor of removing parking minimums downtown

With parking, at left. Without parking, at right.

[A condensed version of this post was delivered as testimony to the Zoning Commission regarding revisions to DC’s downtown zoning ordinance, Title I, on Thursday, 14 November.]

Matt Yglesias visited Chicago and was shocked at seeing high-rise parking podiums downtown, calling out parking minimums as a policy tool to “tax the poor to subsidize the rich while damaging the environment and the broader economy.”

It’s a bit unfair to pick on Chicago’s above-ground garages, since its downtown parking minimums are not terribly high by American standards. Above-ground garages sit beneath many of Chicago’s skyscrapers due primarily to the city’s high water table, which makes excavating underground parking prohibitively expensive (particularly in relation to the city’s relatively low property prices). While the downtown streetscape isn’t as dominated by parking podiums as Miami‘s (the ratios are substantially lower), the podiums definitely make a visual impression from the street and especially from the below-street-level river. The city’s increasingly stringent “landscape” requirements masked their visual impact — they’re now required to be fully enclosed, clad with similar materials to the buildings they support, and often mechanically ventilated — but it’s still pretty apparent what’s behind the fake walls.

When I lived in Chicago almost ten years ago, I chaired the Zoning for Transportation Equity Coalition, which sought to keep the city from baking a substantial increase in parking ratios into its otherwise sensitive and laudable new zoning ordinance. We enlisted several affordable-housing and environmental groups, but were not able to get market-rate developers, anxious about crossing the administration, to support us on the record. Ultimately, we succeeded in nudging the ratios down somewhat, and created such a ruckus that I think we distracted them from noticing bigger cuts in the ratios applied to downtown zones.

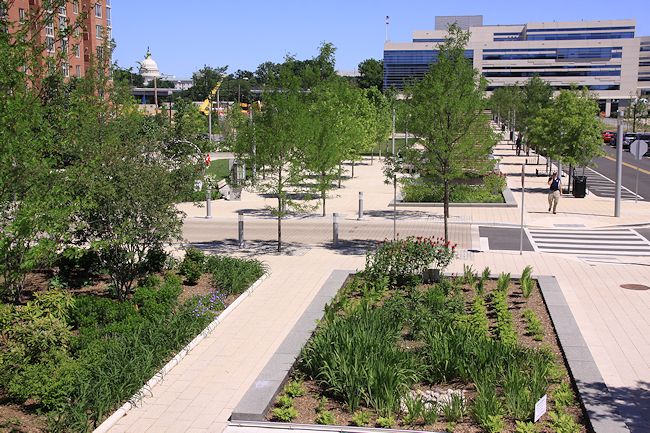
I am here to assure you that since then, downtown Chicago has thrived — its population has grown by 50,000, faster than any other central city in America, sales tax receipts and payrolls have both grown 50% faster than the region, and best yet, no parking riots have ensued. And here in the District, we have a more robust transportation system than Chicago: a larger rapid transit system, more walking and cycling commuters, fewer people driving to work. Furthermore, our trend lines sharply favor transportation alternatives: from 2000-2011, 1/7 of D.C. commuters switched away from cars.

For the politicians who were in charge of Chicago’s zoning rewrite process, increasing parking ratios was a no-lose proposition — an example of a free-lunch, “tax foreigners living abroad” strategy with zero present cost and only nebulous future costs. Because zoning requirements only apply to newly constructed buildings — zoning review is applied when a building permit is pulled — zoning requirements are a “newcomer tax,” levied only on speculative new construction that might or might not happen. Politicians can act like they’re “doing something” when, in fact, nothing has improved.

Similarly, advocates of parking requirements completely confuse today’s phantom “parking problem” and the zoning process. Barring wholesale reconstruction of the city, there’s no way that zoning requirements will appreciably change the parking situation today, or even in the near term. Most of today’s buildings provide parking — literally several tens of thousands of garage spaces exist downtown — and will continue to.

Even at subsidized prices, though, demand for that parking just is not high enough to fill the available spaces. Drivers’ inability to find free parking spaces outside their offices is no more deserving of a public policy response than my inability to find a free cappuccino waiting outside my office. In Chicago, one high-rise apartment developer told me that 70% of the spaces he built under the old parking requirement went unused, and the supermarket manager downstairs told me that the costly underground garage his bosses had insisted upon went empty. At newer and higher-end towers that are much further from transit (in Lakeshore East), Crain’s reports that 60% of residents forego parking spaces.

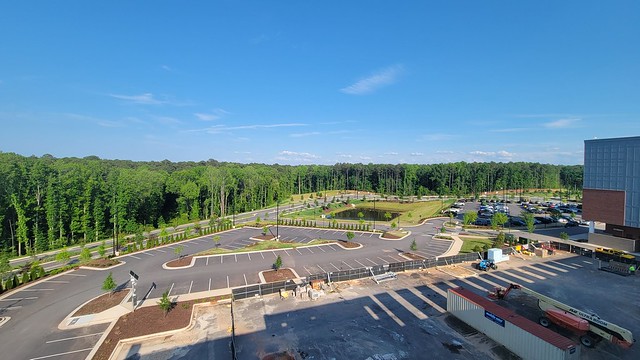
In downtown D.C., a Colliers market survey of downtown parking garages, which collectively can house several tens of thousands of cars, finds that 90% have spaces available to rent, and that garages are 20-40% empty during the day — similar to downtown Atlanta. Unreserved garage spaces downtown rent for the equivalent of $17.28/sq, ft./year, in a city where office and retail rents for well above $50, residential rents above $30, and even basement storage spaces rent for $24. The market rate for off-street parking in my downtown-adjacent neighborhood is less than half as high as in downtown, but spaces are still widely available. This pattern is consistent with the scientific literature; Bowman Cutter and Sofia Franco wrote in the July 2012 issue of the journal “Transportation Economics” that even in Los Angeles, land dedicated to on-site parking is valued significantly below the remainder of parcels.

There simply is not demand for parking that pays its own way. Thus, a parking minimum demands that the rest of us subsidize one economically infeasible land use above all others. Furthermore, a minimum demands that parking be provided, at especially high cost, within each building downtown — raising the already high cost of construction downtown, discouraging development in the most economically productive part of our region, and hurting property values in the area which pays most of the District’s taxes.

Nor will the sky fall if parking minimums go away; new buildings will still have as much parking as is necessary. A few months ago, I was at a panel where a representative from one of DC’s largest developers said that the major transit-oriented development they had under construction “was over-parked” relative to its zoning, because:

Michael Manville of Cornell University, writing about new housing built in downtown Los Angeles after an ordinance partially repealed parking minimums, found that “across all of the [exempted] rental projects, the average amount of parking installed was 1.2 spaces per unit. That’s more than the waived quota of one space.” What happened was that many of those spaces could now be provided more economically and with more flexibly, perhaps off-site or shared with other uses. What’s more, housing construction boomed — if you haven’t been lately, downtown Los Angeles has become quite lively — and the car-free housing units were significantly cheaper.

Parking is a dynamic land-use market that can be fulfilled in many ways, not only through the particularly high-cost/low-return policy lever of zoning requirements. As economist Ed Glaeser writes, “Minimum-parking requirements are a second wrong that doesn’t make a right. The original wrong is that we’ve never charged automobiles properly for using city streets, either for driving or parking.” More realistic and market-responsive prices for off-street and on-street spaces would make even more spaces readily available, with more transparency and less frustration for all. We already know that a finite supply of street parking spaces exists; it would be easy enough to allocate those via auction, splitting the supply between annual, monthly, and hourly permits. (Singapore does this with car license plates, but strangely not with their HDB parking lots.)

Better pricing can better allocate and manage the myriads of spaces that already exist: performance pricing metered and permitted on-street spaces, smarter loading zone management, sharing spaces between uses, renting out existing garage spaces, valet parking, automated garages, parking lifts, and increasingly intelligent car-sharing. The ultimate potential of better managing existing auto infrastructure is absolutely huge. If sharing can get the average American car out of the garage for just four hours a day — vs. the 1 1/2 that’s typical today — the same number of car trips could be made with 70% fewer parking spaces.

It’s these kinds of innovations that have recently started to earn the District national accolades — just today, Fast Company named D.C. the nation’s fourth-smartest city largely because of our increasingly smart transportation infrastructure. This proposed revision to the zoning ordinance can spur further innovations, increase productivity, save money, and might even help us exercise and lose weight.

Quick bibliography: shared streets

Shared streets came up a few times in discussion at Place Summit this past weekend — praised as a “complete streets” solution that’s slower, narrower, more urban, and less auto-oriented, instead of the wider roads (with bike lanes!) that many DOTs have ended up with. It turns out that the NACTO Urban Street Design Guide does offer design guidance for both residential and commercial shared streets, and for “green alleys,” their term for a shared alley.

sharing is caring

Katherine Watkins from Cambridge, Mass. presented at the 2012 NACTO conference on her city’s experience with three shared streets — one side street and one alley off Harvard Square, and one residential street. Her presentation has photos and example municipal code clarifying behavior on the shared streets: drivers must yield to pedestrians at all times, and the speed limit is 10 MPH. The NACTO guide also mentions a residential shared street in Santa Monica.

Cady's Alley, rainy day

Several experiments with shared streets are underway in the Washington, D.C. area. Most famous is Cady’s Alley, a thriving destination for high-end design retailers tucked between busy M Street and the C&O Canal in Georgetown. Developers have long struggled with how to activate the deep block of former warehouses on that block (most famously with the white-elephant Georgetown Park mall) , and here Anthony Lanier, the impresario of Georgetown real estate, has successfully created an environment that simultaneously honors the area’s 19th-century industrial heritage, incorporates cutting-edge design, provides an inviting and durable pedestrian environment, and makes so much money that he’s at it again. (I didn’t know until now that Leopold’s Konditorei was a loss leader, but it could have fooled me: it’s a fantastic place-maker and a treasure.) Approval of the street design was facilitated by the fact that it’s an alley, and therefore not subject to the usual street design standards — pedestrians aren’t expected along alleys, and therefore sidewalks don’t need to be provided.

Update: DDOT proposes a shared street (see option 2, “Flex space”) as one option to improve an existing multiway boulevard’s service lane.

Wales Alley via Google Street View

If all goes according to plan, Virtue Feed & Grain in Alexandria will soon sit at the intersection of two public shared streets: Wales Alley, which it recently converted into a shared ROW, as well as Union Street on the other side. Toole Design Group is leading the study process.

Other local shared streets have benefited from being built as private drives:
Brookland Arts Walk

Bethesda Lane

Mosaic District

From top to bottom, these are the Brookland Arts Walk and Bethesda Lane, both pedestrian streets which are open only to delivery vehicles, and District Avenue at Mosaic in Fairfax County, a more conventional street that happens to be curbless. On a much larger scale, the Wharf, a 3.2 million square foot mixed-use development, promises that all of its internal circulation will be along shared streets. (Both the Wharf and Georgetown have to undergo federal review, via the Commission on Fine Arts.)

L Street Shared Street, photo by Jacqueline Dupree/JDLand

Perhaps more interestingly, Washington Canal Park, across from the US DOT headquarters, converted the two side streets running across the site into curbless streets with lighted bollards. OLIN was the landscape architect for this Sustainable Sites Initiative pilot project.

A few other experiments have occurred around the country:

Market Square

Market Square in Pittsburgh (PPS-inspired redesign)

look ma, no curbs

Flanders Festival Street in Portland’s Chinatown (technical summary by Ellen Vanderslice for ITE)

Pearl Mall

In Columbus, Ohio, Pearl Alley went from being a convenient cut-through (in a city of excessively wide streets), to a popular summer farmers’ market, to a small-scale retail artery along a shared street.

Of course, they’re also very common outside the United States, including:

Walter Hardwick Avenue

Vancouver, B.C, where this woonerf is an integral part of what made this the first LEED ND Platinum neighborhood

Stephen Street Walk

Calgary, where partially re-opening a pedestrian mall was integral to its regeneration

shared street

Throughout Japan (this is in the small mountain city of Matsumoto), where shared local streets might even constitute the majority of street frontages.

Red light cameras: another false “controversy”

[On deadline this week & next week, so no grand posts for now. Instead, here’s something I adapted from an online argument about red light cameras. However, I do have some meaty posts on their way.]

I know that red light cameras aren’t popular, but (1) car crashes kill about as many Chicagoans each year as murders, and many more in affluent areas; (2) the consensus of peer-reviewed research [e.g., Bochner & Walden, ITE Journal 80.5; Persaud et al, TRR 1922] shows that RLCs are significantly effective at reducing crash severity. Yes, the number of rear-end crashes increases, but the number of right-angle crashes declines by more, and those are much more severe crashes: not only do they occur at higher speeds, but directly impact the passenger cabin. RLCs would be a good investment in safety even if they did not pay for themselves.

The popular press has a way of taking a peer-reviewed study, and quotes from actual experts, and “for balance” contrasting those with quotes from less rigorous research or just base speculation. In this particular instance, the contrasting study is not peer-reviewed, does not consider crash severity, and likely doesn’t pass statistical significance.

It appears that the popular press more broadly is fabricating evidence against RLCs, appealing to readers who want to absolve themselves of responsibility for their poor driving habits (and dodge the accountability that RLCs provide). People don’t like to be reminded of the horrific consequences of driving, after all.

Wider fronts in the not-war on cars: the East Coast & the world

More data points that I’d meant to post in last week’s update from the trenches:

1. Doug Short has graphs of population-adjusted VMT going back to 1971. Interestingly, most of the decades seem to see pretty steady growth, with growth rates (relative to 1971, so not even accounting for the larger base) declining in the 1990s, leveling off in the early 2000s, and beginning a sharp decline thereafter. The cumulative effect of that curve? Americans drive about half as many miles as would have been projected in the late 1980s, based on the fast-growing trend line at that time. Time to shred all those old highway plans, folks! (Via Brad Plumer‘s latest post on VMT trends)

2. A bunch of papers and videos from the OECD on driving trends in the USA, France, Netherlands, Mexico, Japan, and Australia. (Also via Plumer.)

3. “Gasoline demand stayed flat in states bordering the Gulf of Mexico or in the Rockies. But on the East Coast, it has slipped 10% below its peak level…. it has accounted for half the overall drop since the [peak]… The more striking trend: East Coasters are simply driving less. Vehicle miles traveled in Northeast and South Atlantic states in the year ended in March were 4.2% lower than in the same period ended in September 2007. In the rest of the U.S., they are down just 0.5%.” — Liam Denning, WSJ

Vehicle mix also factors in: “Real Americans” are 2.62X more likely to buy pickups than us effete eastern elitists, and 11.6% less likely to buy a hybrid car, but I doubt that vehicle mix has changed enough over the past few years to explain the differing outcomes.

4. I took this photo in 2005; it was in 2004 that the VMT trend began to sputter. In 2013, the gas station has closed, and a Tesla dealership opened across the street. So yeah, it’s tough to be in the gas biz these days.

$4/gallon, here we come!

5. Of course, Todd Litman from VTPI is always more comprehensive about this topic than anyone else. Here’s his 30-page take, which he updates frequently.

6. Contrast these data points to the comparatively rosy (for carmakers, and therefore awful for the planet) scenario recently posited in the Economist:

One reason for concern is that half the world’s population now lives in towns and cities, which have only so much space for cars… Young urban residents may also be meeting up less often in person, thanks to social-networking sites that let them keep in touch digitally. So they have less need for a car… In particular, the generation who came of age after 2000, the so-called “millennials”, express a preference for having access to rather than owning cars…

[S]tudies also show a marked rise in the proportion of elderly people with driving licences. Baby-boomers pretty much all learned to drive, and now that they are beginning to retire they expect to continue motoring. The development of assisted driving, followed one day by fully automated cars, will allow them to stay mobile for much longer.

What may be happening in rich countries is a one-off shift in the timing of people’s driving careers, so that they start later but then continue well into old age. This may be no bad thing for carmakers… So it is not clear that declining car ownership among young urbanites will have more than a marginal effect on overall car sales….

All in all, “peak car”—the point at which worldwide demand for cars will stop rising—still seems quite a long way off. In the rich world some of the economic factors that have deterred young people from taking up driving will fade away: as cars become increasingly self-piloting and accident rates fall, insurance costs should decrease, and in time there will be little or no need to take expensive lessons.

Perhaps true, but retirees generally don’t travel very far, and VMT/capita drops off considerably at retirement. Crowded cities in developing Africa, Asia, and Latin America have less potential for car growth, and have arguably embraced many transportation innovations faster than the rich world has.

War or not, it’s working

“…because the mayor hasn’t declared a war on cars. I doubt that anyone disagrees that we need to reduce traffic. I would call it an effort to get people to use alternative transportation.” – Mayor Vincent Gray, 20 February 2013

Okay, so I think we’ve established that there is no war on cars. But call it what you will, “efforts to get people to use alternative transportation” do seem to be working quite well, as steep declines in people using cars to get to work (lighter lines) are declining vs. people using “sweet modes” increases (from MWCOG research):

How Washington, D.C. residents get to work

One net result is that the doom-and-gloom traffic apocalypse predictions are now no longer valid. Even if VMT resumes its 40-year upward track — an exceedingly unlikely occurrence given recent trends — the past several years of flat or declining VMT has permanently dented the total, and therefore the amount of road space needed in the future (from OSPIRG):

VMT increase projections

Driving is not coming back. It’s time to get used to it.

Diseases of affluence cured by…

removing affluence, of course. Or, put another way, saving money can sometimes save lives.

Population-wide interventions (in this case severe austerity) reduced chronic disease burden in the very unique case of Cuba’s “special period,” an economic catastrophe that struck a society that is peculiarly undemocratic, resilient, and underpinned by strong public health resources (and thus has excellent data). From Richard Schiffman in The Atlantic, summarizing an article by Manuel Franco, Usama Bilal, et al in BMJ:

that the health of Cubans actually improved dramatically during the years of austerity… based on nationwide statistics from the Cuban Ministry of Public Health, together with surveys conducted with about 6,000 participants in the city of Cienfuegos, on the southern coast of Cuba, between 1991 and 2011. The data showed that, during the period of the economic crisis, deaths from cardiovascular disease and adult-onset type 2 diabetes fell by a third and a half, respectively. Strokes declined more modestly, and overall mortality rates went down… The Cuban experience suggests that to seriously make a dent in these problems, we’ll have to change the lifestyle that helps to cause them. The study’s authors recommend “educational efforts, redesign of built environments to promote physical activity, changes in food systems, restrictions on aggressive promotion of unhealthy drinks and foods to children, and economic strategies such as taxation.” […] If the United States want to stem the rise of diabetes and heart disease, either we get serious about finding ways for to become more physically active and to eat fewer empty calories — or we wait for economic collapse to do that work for us.

The authors (and I) do not condone replicating the Special Period crisis, but as a data-collection exercise it is unique in providing a look at the effects of unprecedented, population-scale, sudden change in both diet and exercise. The primary cause of removing fossil energy had a secondary effect of removing food energy from the economic system, as well, and increasing its expenditure to make up for the lost fossil fuel. The accompanying video (at the BMJ site) has interesting graphs of how the entire population’s BMI shifted both during and after the Special Period.

Same road safety crisis + different contexts = different results

When urban America motorized in the 1920s, it faced a crisis of children crushed by cars, with 7,000 deaths in 1925. Our solution then was to blame the victim, ban pedestrians from the streets invented for them myriad years ago, and turn over the roads to cars. Today, ~7,000 pedestrians each year still die on American streets, in addition to the untold violence our auto-centric transport system wreaks upon local and global ecosystems. This process was extensively documented in Peter Norton’s book “Fighting Traffic.”

Holland faced the same crisis in the 1970s — after feminism, environmentalism, historic preservation, and the bike boom had emerged — and arrived at a radically different and much safer solution for both humans and our planet. London Cyclist magazine has the full story on how “Stop de Kindermoord” (yes, the unsubtle “Stop Killing Kids”) catalyzed these movements and created one of the world’s safest road cultures.

If you’re now inspired to rearrange the streets that you traverse — add some trees, a turning lane, a cycle track, wider sidewalks — you can go ahead and easily try out a new street section at StreetMix. (Hint: you can easily measure street widths using the ruler in Google Earth.)

(H/t to Eli at Seattle Neighborhood Greenways.)