
Want a car-free day-trip escape one of these last few weekends of summer? I wrote about four county fairs and eight transit museums you can get to from DC.
Read originals at Greater Greater Washington:
Want a car-free day-trip escape one of these last few weekends of summer? I wrote about four county fairs and eight transit museums you can get to from DC.
Read originals at Greater Greater Washington:
(Sent to Raleigh City Council)

I urge you to support Z-92-22, the New Bern Avenue TOD overlay mapping.
As a student at Enloe High School in 1996 (photograph at right), I gained some unpopularity for suggesting that students ought not to complain about parking and press for a costly parking garage, because other options existed — i.e., the city bus. 30 years later, a faster and better city bus could be an option for more residents, but only if City Council lets people live nearby.
In short, this is a vote on whether or not Raleigh transit succeeds. Transit succeeds when it has a mass of people to transport, and without TOD this BRT will fail, just like the many other transit plans that Raleigh has drawn up over my lifetime.
In a 2016 referendum, 262,634 Wake County voters said yes to this specific Bus Rapid Transit line, obliging the city of Raleigh to create a mass transit system — not just to deliver the transit project, but also to ensure its success by making it useful for a mass of people. The federal government, which is funding half of this project, is closely evaluating whether federal taxpayers’ monies are well-spent in places whose zoning laws truly welcome transit. The federal government has made it amply clear that it has learned the lessons of places like Los Angeles and Denver (as amply reported in NPR’s series “Ghost Train”) which wasted billions in federal funds on building empty new transit lines in locations that lacked a mass of residents and businesses.
Raleigh’s failure to federal transit funding in the past was entirely because our land use plans have not supported transit. This has been the story since I was a child, and now I’m middle-aged. You finally have a golden chance to make transit work in Raleigh by passing Z-92-22.
Most of the fearmongering around this rezoning has centered on displacement. TOD overlay zoning is the only Inclusionary Zoning tool that Raleigh has at its disposal, and therefore voting FOR this rezoning is a vote to bring inclusionary zoning here. This rezoning will focus more development on under-used commercial land and large-lot houses, reducing the pressure for flippers who are already displacing residents from nearby neighborhoods.
As Congresswoman Alexandria Ocasio-Cortez says, “the reason why people are on the streets isn’t just some elusive housing or market phenomenon. It’s because we’ve chosen not to build.” The voters of the city of Raleigh have risen to the challenge by approving funding for affordable housing, but now we need places to put it – and Z-92-22 does just that. The city has invested mightily to prepare by buying affordable housing sites within this overlay district.
Zoning for housing is the progressive thing to do. Data For Progress analyzed every 2020 presidential platform and found that “every major Democratic candidate for president endorsed an explicitly pro-housing platform, calling for an end to exclusionary zoning,” while many Republican leaders have attacked Missing Middle zoning reforms using thinly veiled racist language. In his final act in Congress, the Triangle’s own David Price passed the Yes In My Back Yard Act grant program as part of the 2023 federal budget.
A “no” vote on Z-92-22 is not a vote for some magical, supernatural, and completely nonexistent perfection that might exist in the future. Instead, a “no” vote on Z-92-22 is a vote to perpetuate an unjust, unsustainable status quo of cars and sprawl: for bulldozing thousands more acres in Wendell, more deadly car crashes on the Beltline, more carbon pollution to drown our precious beaches, to perpetuate the exclusionary covenants that banned both people of color and renters from Longview Gardens.
There has been enough study and delay; the Equitable Transit-Oriented Development Guidebook recommending this rezoning was issued in July 2020, almost three years ago. Now is the time for action.
I thank you for your attention. I look forward to further working with the City of Raleigh to advance our shared vision of a greater Raleigh.
Sent to the WMATA board via CSG’s template:
I am Payton Chung, a regular Metrorail rider and chair of the DC Sierra Club’s smart growth committee (although I speak for myself). I use Metro both late at night as well as on weekend mornings (when the Sierra Club begins day hikes), and I oppose a permanent cut in Metrorail’s hours.
If the service-hour cuts become permanent, Metro will have more limited operating hours than any large US rail transit system, and at lower evening frequencies. Metro should learn from how other major US rail systems perform inspections and maintenance without shutting down the entire system. I lived along the Blue Line in Chicago, which is a two-track line (parts of which were built 100 years ago) that operates 24/7. When track maintenance is done (and a major renewal is underway presently), it is done by suspending service on part of the line and providing shuttle buses.
In that spirit, I understand that temporary service suspensions may be necessary from time to time. However, these suspensions must be of limited duration, must be outlined clearly in advance, must achieve specific maintenance and repair goals, and absolutely MUST be paired with adequate alternative service. The Coalition for Smarter Growth has outlined several principles along these lines.
Metro already suspended late-night service months ago without providing replacement bus service. As a result, Metro has been wasting money running nighttime buses that begin/end their routes at shuttered Metro stations like Pentagon, King Street, and Rhode Island Avenue. Regardless of WMATA’s ultimate decision regarding service hours, this farcical and inexcusable situation must end.
Thank you for the opportunity to address the region’s critical mobility needs.
Autonomous vehicles, driverless cars: ask two people what they think, and it seems like you’ll get three opinions. Here are my reactions to four recent publications on the topic — keeping in mind that previous reports of distance’s death were an exaggeration. (As CBRE’s Revathi Greenwood notes, vehicle speeds won’t change, and so Marchetti’s Wall still remains. Even if the drudgework of driving is taken away, travel time still has a cost, and we’d rather be at our destinations already — e.g., “are we there yet?”)
WSJ (columnist Christopher Mims):
Kelley Blue Book consumer survey:
Rocky Mountain Institute forecast:
City Observatory (Joe Cortright) [part 1] [part 2]:
What everyone agrees upon is that this is the first huge shift in metropolitan mobility since the 1940s-1980s shift towards mass car ownership. It’s important to remember that American suburbia is a political and social construct, not a fact of life, and that policies put into place immense structural supports for American suburbs.
You can see the Capitol Dome from here. Photo by Eric Fidler, via Flickr
Yes, the McMillan Sand Filtration Site is one mile (from either end of the site) to the Red Line. It’s even 0.6 miles to the nearest express bus route (Georgia Avenue’s 79), and key network improvements are still in the planning stages. Yet from the point of view of someone who wants to reduce auto dependence (and the concomitant pollution, injury, and sprawl), what matters most is that MSFS is close to downtown, rather than close to Metro.
Transportation planning research has consistently shown that location relative to downtown and to other land uses is far more closely associated with the amount of driving than location relative to transit. Ewing and Cervero’s definitive 2010 meta-analysis (cited by 679 other scholarly articles) examined over 200 other studies, then combined the correlations found by 62 different studies:

Yes, it turns out that the number of miles that people drive is four-and-a-half times as closely correlated with the distance to downtown than with the distance to a transit stop. This strong relationship between driving and distance to downtown is borne out in local survey research by MWCOG/TPB. Note that whether an area has Metro access (like Largo or White Flint, vs. the Purple Line corridor) doesn’t actually seem to impact the number of drive-alone (SOV) trips.

Some suggest that development proposed for this site should instead go elsewhere. If the development is denied, those residents and employees and shoppers won’t just disappear, they’ll just go somewhere else. They won’t go to superior locations even closer to downtown and Metro (because those are so very plentiful!), but rather to far inferior locations. For instance, the life-sciences employers might choose an alternative location within our region that has already approved a similar mix of uses — such as Viva White Oak, Inova Fairfax, Great Seneca Science Corridor, and University Center in Ashburn, all of which are much further from both downtown and Metro.

This isn’t just the suburbs’ fault. Within the District, even more intensive development than what’s proposed at MSFS has already been given the go-ahead at locations such as the Armed Forces Retirement Home, Hecht Warehouse, and Buzzard Point. All of those sites are also inferior to MSFS from the standpoint of not just transit accessibility and distance to Metro Center, but also on all of the other factors shown to reduce VMT.

If the “Reasonable Development” types truly do care about reducing driving, I must have missed their years of caterwauling over the approval of all these other sites — not to mention the countless suburban developments that together pave over 100 acres of open space every single day in the Chesapeake Bay watershed. That’s why I give more credence to the people who do actually care about paving over the region, like the Piedmont Environmental Council — a/k/a the Coalition for Smarter Growth.

The entrance to Hong Kong’s airport express train is somewhere within this mall. The cross-border bus terminal entrance is somewhere else entirely, and the actual “public” spaces are completely dispiriting.
When I was a small child, John Portman-style complexes were architecture’s futuristic vision: Someday, we’d all live in hermetically sealed downtown compounds of office and hotel skyscrapers set atop multi-story podiums.
My family stayed in several of these hotels on trips; sometimes, my mom would tell me about how she, as a child in Hong Kong, had dreamed of a city of skyscrapers and layers of indoor shops, all suspended above grade so that buses, boats, and cars could fill the ground plane.
That hyper-dense Modernist vision eventually came to pass in much of central Hong Kong, fed by not only its unique geography but also by its unique private-provision model for both rail and property. There’s danger, it turns out, in putting developers in charge of your rail stations; the “gift horse” of free infrastructure comes with strings attached.
When private firms are put in charge of designing pedestrian circulation networks, they will place their values — primarily shuffling eyeballs past storefronts — over the public’s need for legible, direct links from A to B. The tremendously high value of rail access behooves developers to elbow their way closer to the station; the location imperative isn’t to be near transit, it is to be at transit; to make it not just easy, but necessary to traverse their property. And, once the development has cornered the transit station, it will seek to entrap the resulting pedestrian flows within a spiderweb of passages. As Chris DeWolf writes:
Last month, a survey of 657 Tsim Sha Tsui pedestrians conducted by urban design watchdog Designing Hong Kong revealed that 77 percent prefer using street-level crossings over footbridges and subways… “The problem is that bridges and tunnels force you into particular routes that limit your ability to take the shortest path,” says Designing Hong Kong convenor Paul Zimmerman. “People also pick attractive routes. That’s a very qualitative statement, but part of what makes a route attractive is being able to see other people, to window shop, to have an experience. With subways and footbridges that becomes quite limited.”
An early version of this phenomenon can be seen in Montreal’s underground city, the most valuable retail frontage is as close to the train platforms as possible. Thus (almost as in casinos) the developers twist and turn the corridors to herd people past the shops. Future iterations of the phenomenon will soon be unveiled at the World Trade Center mall and at Hudson Yards.
Edit 7 Jul 18: author Marion Girodo has a book of “urban mangroves,” the multilevel urbanism that crops up around metro stations in Montreal, Paris, and Singapore.
Edit 17 Jan 17: Henry Grabar in Gothamist writes of “the oculus”: “If Grand Central is a train station with some shops, the Oculus is a shopping center with some trains.”

Want to get to the PATH, or cross West Street to get to the Hudson? You’ll have to walk down this hall, and oh by the way there are plenty of shopping opportunities.
A similar landscape may be emerging at Tysons Corner, where the in-process retrofitted suburbia — now and forevermore ridden with alienating highways — shows little sign of ever becoming a Greenwich Village sort of urbanism with small blocks of public streets lined with small-but-tall buildings. Instead, the spatial complexity that’s emerging is of a very different, much more Portman-esque sort. Philip Kennicott writes in the Post:
The decision to elevate the stations — a far less expensive approach than burying them — may well presage this sleek new world of elevated plazas and public areas, disconnected from the ground. A new office building across from the Tysons Corner station is built atop a parking garage, so that at ground level one faces a seemingly impenetrable plinth. Already, a web of pedestrian bridges — some built by Metro, others by private developers — is emerging, keeping us safely above the world of machines and hydrocarbons and asphalt…
One wonders if you will emerge from these stations with [a] sense of pleasant surprise and rootedness in the urban landscape… Likely not. Rather, you will emerge, slightly disoriented by the ever sameness of the commercial and physical space around you, wondering for a moment if you have arrived at the right station, before your basic sense of purpose — to get home, to find a restaurant, to locate a shop — kicks in, and you begin to move by habit and instinct through a pleasantly unobtrusive world of concrete and glass that could be anywhere.

Tysons Corner Center’s “Metro Plaza” under construction. At left, the bridge to the station, at right, the bridge to the mall.
At Tysons Corner Center, the megamall at the heart of Tysons, building a bridge keeps the distance from station to mall is 300 feet — a 1.6 minute walk. The bridge siphons customers directly into the mall, creating tremendous value in three dimensions: “You’ve got a first floor on the first floor and a first floor on the second floor, so you’ve solved the verticality problem” [of pulling mall foot traffic from the entry to different levels], Timothy Steffan, an executive for mall owner Macerich, told the Post’s Jonathan O’Connell.
This Disney-esque strategy of spiriting people directly into an immersive environment has ample precedent: in fact, Roppongi Hills, a fantastically successful redevelopment in the heart of Tokyo, also uses an elevated plaza to deliver customers from the subway onto the development’s podium. The experience for customers who drive in is akin to what Rick Caruso’s malls or skyway’d downtowns provide: parking garages deadening the street environment all around, but a fantastic public space within. Sure, bus and bike customers have to deal with an ugly exterior, but the privileged modes (driving and heavy rail) get the red carpet.
My first instinct is to warn “creative” policymakers to be careful what you wish for: these projects result in such high cost and complexity that the only financially worthwhile result is a giant mall. They’re so huge, boring, and bland because of private value capture. Finding room in a private developer’s pro forma to build expensive underground rail infrastructure requires selling stupendous quantities of expensive corporate real estate, which will never be cool and lively. It also requires generous, greenfield-esque parcel sizes. In the worst case scenario, the project fails, and there’s nothing worse than a white elephant in the middle of the room.
Yet as dispiriting as these initial examples are, there’s a glimmer of hope that they’ll eventually be okay. With enough time, enough density, and enough owners, even these bland malls could evolve into something interesting. Hong Kong’s experience shows how the weird linkages that result from generations of ad-hoc decisions and relentless foot-traffic flows have created a hyper-dense end result that can be beautifully complex in a postmodern, emergent-urbanism way. This isn’t immediately apparent from the workaday commercial architecture, but can be mesmerizing when expressed in diagram form — as the recent book Cities Without Ground shows (high-res image slideshow). A two-dimensional plan, or even a figure-ground diagram, is useless when expressing vertical spaces.
Hong Kong architect Peter Cookson Smith described this structure in more essentialist terms in The Urban Design of Impermanence (pg. 84; excerpt):
A cityscape of streets, internalized routes and multi-level links, even without clear articulation, is open to casual exploration, and there is little need for city form to be overly organized or pronounced in order to be legible… This underlines an essential difference between the formal framework of Western public spaces and the more diffused and informal realm of social space associated with the Hong Kong street, where the relationship between public and private spaces is less tangible, and the routes between them work just as effectively in three dimensions as in two.
Perhaps China’s homogeneity and sheer density (bear in mind this is about 1-2 orders of magnitude higher than urban America’s) might increase social trust and thus break down the hierarchy of spaces — people there feel more comfortable wandering down dark alleys. Yet perhaps we could shortcut to that future: emerging spatial technologies, like smartphone-based mapping, are quickly obviating highly legible spatial hierarchies. Customers can now just as easily find a shop hidden in the back corner of a buildings as one that shouts its presence with highway-sized signs.
Or maybe not. Toronto’s PATH system is now 40-odd years old, serves more than 100,000 pedestrians a day (so many that its closure would send downtown into gridlock), and has apparently outcompeted street-level retail spaces. It’s also a navigational nightmare of corporate sameness, according to Spacing’s Kieran Delamont:
The PATH is a mall, first and foremost. Beyond access to over half a dozen food courts, at least two massage parlours, and more sushi restaurants than I cared to count, I put it to you that, with its existing wayfinding system still in place, the PATH offers nothing especially preferable over supra-terranean navigation… It is a seemingly endless maze of mall corridors, hallways, and atriums. Unless you are a person for whom the distinctions between Jamba Juice and Jugo Juice are particularly meaningful, everything in this place feels exactly the same; with each new tunnel you encounter in here, the space expands physically while being visually constricted. Because this space lacks the distinctive landmarks that you often find above ground, there is very little to distinguish it from every other mall you’ve been in. The more of it you explore, the less it feels like you could ever remember any of it…
The balance between mall and transit network is slanted heavily towards the PATH’s commercial interests; the dominant incentive of the landowners is to keep you in their slice of the PATH, not to move you through efficiently.
What we need are architects and developers who understand that, and aren’t afraid to create more interesting, if less-legible and less predictable, places — perhaps even fractal-like, medieval-esque street plans in three dimensions.

America’s lower urban densities mean that our over-commercialized transit districts may never quite achieve this level of spatial complexity, but by golly, why not try?
[Previous transit-station walk shed coverage: walk sheds & excessively grand rail stations, walk sheds & water transit]
Look, an LRV with no catenary! The diesel powerplant in the middle (note the stained exhaust vents) produces its characteristic vibration and noise, and unlike a commuter train, the passenger compartments are all subjected to it. It’s also definitely slower; by one calculation, an electric LRV could do the same route 18% faster. It seemed out of place in the urban centers on either end, but more appropriate in the suburban villages in between.
These might be appropriate for other “interurban” lines with wide stop spacing and relatively low station-area densities. Given that most suburban areas are already arrayed along roads rather than rails, and that the train isn’t much faster than a bus, perhaps this isn’t the panacea for suburban transit.

District of Columbia Mayor Muriel Bowser said this week “that the District will not become ‘like Amsterdam,’ as though being ‘like Amsterdam’ would be a bad thing,” says a blog post by the Netherlands Embassy.
The embassy backed up their umbrage with a stylish infographic showing off several metrics where Amsterdam handily surpasses the District — particularly in transportation choices, as Amsterdam offers its current residents more waterways, more bikeways, and more streetcar lines.
For one point, the infographic concedes that the District is bigger and better than Amsterdam: Washingtonians can now legally possess over 11 times as much marijuana as Amsterdammers. But since the Netherlands has more permissive laws regarding the retail sale of marijuana than the United States, many visitors (like, perhaps, Mayor Bowser) instinctively use “Amsterdam” as shorthand for a place with libertine drug laws. (Dutch society has a long history of taking a uniquely hands-off approach to social policy.)
On several other points, though, the infographic shows that although DC isn’t quite there yet, we’re well on our way. DC already has ambitious plans to beat Amsterdam on two points: the Sustainable DC Plan projects another 250,000 Washingtonians, for a total of 868,000 to Amsterdam’s 810,000; and the Move DC plan has plotted out 343 miles of bikeways, including 72 miles of Dutch-style protected bike lanes, which easily beats the mere 250 miles of bikeways in Amsterdam.
DC is also making significant progress in closing the 12-museum gap with Amsterdam. With an ever–growing number of museums here, DC is well on its way to overtaking Amsterdam in this particular metric. (I don’t have statistics handy, but it seems likely that DC has fewer but larger museums, which probably have an edge in terms of collection size and total visitors.)
On two other metrics, though, we have a long way to go. At the current rate of construction, it will be a while until DC manages to build its 16th streetcar line — but note that the Dutch embassy conveniently doesn’t count Metro lines, as DC boasts six to Amsterdam’s five (almost), as construction on their north-south line is almost as delay-prone as our streetcar.
The yawning gap between the two cities’ canal networks is only half as dire as the Dutch say. Yes, Amsterdam has 165, but DC actually has two operating canals, not one: The embassy may have been confused by the name of Washington Channel, which is a brackish waterway built to drain tidal flats and to keep open a shipping channel. In other words, it’s hydrologically far more similar to Amsterdam’s canals than the freshwater C&O.
In any case, I’ll concede that more of Amsterdam is below sea level than Washington. In an era of rising sea levels, though, that’s probably not something worth trumpeting.

A few short topics for January, all around the theme of achieving critical mass in three very different markets for metropolitan services.
1. Nathan Donato-Weinstein, reporting for the Silicon Valley Business Journal about Google’s October purchase of buildings along San Francisco Bay:
Google — which like many expanding tech companies is focused on reducing its car and shuttle trips as traffic worsens during the current boom — may be eyeing transit options beyond freeways. Pacific Shores is a half mile from the Port of Redwood City, where a Google pilot project earlier this year tested running ferries from San Francisco and Alameda to the port. The Water Emergency Transportation Authority, which administers the San Francisco Bay Ferry routes, has studied regular public ferry service to Redwood City, with a potential public terminal practically next door to Pacific Shores.
“I know they really liked the ferry and the concept. Their challenge was getting people off a boat and putting them on a bus to Mountain View, and that was taking 25 minutes,” said Kevin Connolly, director of planning and development for WETA. “This might be one way to address it.” […]
A Redwood City terminal would cost about $15 million. But the county doesn’t have ongoing operational funding, Connolly said.
A major built-in user such as Google could help make service pencil out, he said.
I’ve written critically about the peculiar geometries (and thus poor economics) of water taxi transit before. Having high-density development built on landfill immediately adjacent to a deep-water port certainly solves some of those problems — but a ferry does need at least two ports. However, most other Bay Area jurisdictions have incredibly restrictive development policies along their waterfronts, and many of the Bay Area’s most desirable residential areas are well inland (and atop hills, in fact).
Perhaps last-mile bus service would supplement a 101-bypassing ferry on one or both ends. That adds in the time and hassle of a transfer; when combined with a lower peak speed (around 40 MPH) and increased susceptibility to inclement weather, it’s tough to see how it would be a faster, more reliable, or more fuel-efficient option. (2008 figures submitted to FTA, as reported by Wayne Cottrell in Energies, indicate that ferry operators in the USA have a median fuel economy of about 10 seat-miles per gallon of fuel.)
2. General Growth Properties plans a $2 billion investment in street retail, ultimately aiming to have 15% of its portfolio invested on high streets in the principal gateway cities of NYC, Chicago, Miami, Boston, DC, SF, and LA. Even in these high-rent areas, GGP sees “assets with significant unrealized growth potential,” with below-market rents and under-used vertical space.
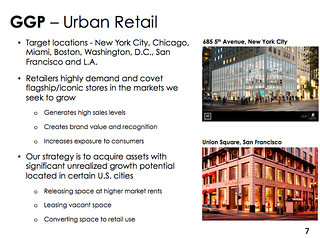
Many office REITs have focused on CBD office, but these properties have historically been neglected by large retail REITs. Adjacencies matter much more with retail than with office, which creates a “commons” problem that undermines streets with fragmented ownership.
GGP has hinted at two approaches to circumvent this. Like Acadia Realty Trust (an exceptional retail REIT that has redefined itself as a high-street owner), it might hope to aggregate enough properties to create its own mall-like ecosystem, and thus internalize the external benefits of its investment. GGP’s first big investment, an equity stake in the Miami Design District, certainly has that advantage. However, the DD is a singular example unlikely to be replicated elsewhere, so it appears that GGP will instead have to rely upon its high-rent neighbors to similarly aggressively upgrade their properties.
This could be a long waiting game, though, since a lot of urban property isn’t owned by others who need the same quick upside that a REIT does. Micah Maidenberg quotes a skeptic in Crain’s:
“The street-retail business, just like luxury hotels and other sorts of high-end projects, tend not to be a quarter-to-quarter-growth kind of business. It’s more of a long-term hold,” says Jeffrey Donnelly, a managing director at Wells Fargo Securities in Boston.
3. Two few weeks ago, I was visiting my parents in North Carolina and feeling under the weather. While looking up my out-of-area health care options, I came across an instructive article in Milbank Quarterly (by Daniel Gitterman, Bryan Weiner, Marisa Elena Domino, Aaron McKethan, and Alain Enthoven) about why Kaiser Permanente’s integrated group medical practice failed in the Triangle — where I’d previously been a satisfied customer.
My main takeaway from the case study was that, while “prepaid group practices” like Kaiser or GHC in Seattle (not to mention vertically integrated government systems like the VA) do offer tremendous cost efficiencies, they also rely on economies of scale that are difficult to set up from scratch.
The article estimates that KP’s break-even point is around 100,000 members in a metro area. That figure would have been a huge ask, given that the Triangle’s population was well below a million at that time, and spread out across a broad area. KP needs that kind of scale to build bargaining power, both:
– on the cost side, when bringing services in-house (the essential feature of their cost-containment model) or bargaining with hospitals and specialists; and
– on the revenue side, when selling their product to employers and employees who have to be sold on a choice that (a) most would find less convenient and (b) involves disrupting the “stay with my doctor” inertia many customers have.
It’s not a coincidence that prepaid group practices are best established in markets where either government employees or unionized employees bulk-purchase healthcare services. But HMOs are beginning to re-emerge now that the Triangle is bigger and denser, the ACA exchange has made the health insurance market less fragmented, and more doctors have organized into group practices linked to specialists via electronic health records. One new option in this year’s ACA marketplace for North Carolina (and especially valued, since last year only NC Blue Cross participated in the marketplace) is Coventry’s CareLink HMO, which uses Duke Medicine’s primary care network as the in-house practice.
I snarkily wrote up a little headline last Monday: “Belmont Bypass’ Immediate Neighbors Slam Outreach, Will Vote On Keeping Bottleneck.” Then Daniel Kay Hertz wrote a somewhat fuller reponse, pointing out that a few people would vote on a project that impacts rail service for hundreds of thousands.
(Not surprisingly, the referendum failed, with 583 votes against. In June 2014, the three rail lines that would benefit from the bypass carried 6,353,313 passengers.)
Many broadly beneficial, but locally detrimental, projects are subject to being torpedoed by hyper-local concerns. As with any Locally Undesirable Land Use (LULU), the benefits are broadly distributed but the costs are highly focused. Many will gain a bit, but the benefits are in the distant future and somewhat speculative, so the issue has soft salience to the majority. On the other hand, a few will lose a lot, so those loss-averse few have a strong incentive to fight tooth and nail against threats to their homes. It’s just human nature.
Later comments directed at both Hertz and I raised the specter of Robert Moses bulldozing East Tremont for the Cross-Bronx Expressway. Yes, there are some surface similarities: properties expropriated for a transportation improvement. Yet these projects differ incredibly, not just in what is being done, but more importantly in how they are done.
@urbanophile @DanielKayHertz Had to check twice to make sure it wasn’t a guest post from Robert Moses.
— ted whalen (@tewhalen) November 6, 2014
A new highway arguably fails a cost-benefit analysis once social costs are calculated: It exacts leviathan costs, from destroying communities to contributing mightily to destabilizing the planet’s climate. (This probably even applied in Moses’ era, before thousands of miles of highways were built, subjecting further investments to the law of diminishing returns.) A new transit connection has a much better balance sheet. The Belmont Bypass has particularly high leverage, since it finally unleashes the bottlenecked potential of the miles of four-track structure beyond it.
Majority rule must respect minorities’ basic rights, but freedom from construction dust isn’t in UDHR. @tewhalen @DanielKayHertz
— Payton Chung (@paytonchung) November 6, 2014
More important is how the project is executed. In a democracy, the majority rules with respect for the basic rights of the minority. Moses infamously low-balled property owners when seizing land, and paid tenants (and rent-controlled tenants in an era of high housing inflation arguably hold a claim resembling property) almost nothing; such expropriation is clearly contrary to the Fifth Amendment or to the UDHR‘s Article 17.
Several property owners stand to lose their property to the Belmont Bypass. In such a high-profile situation, which public opinion broadly in their favor and multimillion-dollar properties on the line, I imagine that this group will receive just compensation — quite unlike the residents of East Tremont, who were largely ignored by the press, whose cries for help went almost entirely unheard by their legislators, and who lacked funds to file lawsuits.
Yes, a slightly larger population will be inconvenienced by construction for a few years, and this crowd appears to have provided most of those damning 583 votes. While pollution, even non-toxic pollution such as carbon, can justifiably be construed as violating others’ right to life, the noise and dust from construction can be mitigated to a significant extent.
In short, the substantial benefit that the majority will derive can justly be seen as outweighing the relatively minor rights claims in this instance, and the comparison to Robert Moses is spurious.
Of course, it’s rare for citywide transit agencies to make decisions at the hyperlocal level. Yet it’s absolutely typical for decisions to be made about permitting additional housing at almost a parcel level; in that case, the marginal benefit to other regional residents is so marginal as to be doubted entirely. Yet affordable rentals, in particular, are a LULU that local NIMBYs have successfully engineered the regulatory regime to discriminate against. Ryan Avent writes in the Economist: “The benefits and costs of population growth occur in a way that practically guarantees highly restrictive building rules.” Michael Lewyn takes the view that “cities cannot be trusted to weigh the citywide interest in new housing against neighborhood concerns… the chances of abuse are simply so high that a higher authority must step in.”

Trail underpass in Greenbelt, Md.
A century ago, cars first started appearing on city streets and subsequently began running over everyone else. The 1920s epidemic of traffic fatalities, particularly among children, led to a fad in town planning to rigorously separate paths for cars and people, and to turn over the roads entirely to cars.
This philosophy was implemented in several New Towns — most notably in Radburn, New Jersey, but more extensively in three suburban Washington communities (Greenbelt, Columbia, and Reston). For the most part, though, existing cities proved too expensive to retrofit, and most other American suburbs just built the car-only roads without their pedestrian counterparts.

Greenbelt Museum
In both Radburn and Greenbelt, houses were even “turned” to face the walkways, with back doors facing alley-like auto access roads. Yet as these places have matured, most households have rotated their houses and enclosed their public front yards into private backyards; communities have added sidewalks to the streets. (Above, the museum/house at right has been restored to its original appearance, but the house at left is typical.)

Trail crossing street in Lake Anne Village, Reston, Va.
Examples built from the 1960s-1980s, like Reston, typically threaded trails past backyards. LIFE magazine wrote in 1965: “The need for automobiles in the village is virtually eliminated by a network of footpaths and bridges which connect residential areas with the shopping center.” (Indeed, my own 1960s neighborhood was replatted with a half-completed secondary grid, which I do use occasionally.)
Interestingly, two of my Streetsblog colleagues, Jeff Wood and Steven Vance, both lived in Kingwood, outside Houston, and both made extensive use of the trails as kids. In an email exchange, Steven writes:
Those trails, the Greenbelt, connected every subdivision with homes (there was an entrance 50 feet from my house), community pools, and passed behind every school. They also took me to the shopping areas. I “delivered” myself and my sister to school and the pool.
Jeff Wood made a distinction between walkability and runability on a recent episode of the Streetsblog podcast (sorry, can’t find the link!). While the trails in these communities are still prized as a recreational amenity, they are not a useful travel option for adults because they’re not really “irresistible”: distances are far (because densities are low), travel paths are circuitous, and there’s frankly not much to look at. While those attributes were suitable for Jeff’s track and field team, they don’t suffice for people walking to destinations — and who have the option of driving instead.

It later occurred to me that neighborhood-level household travel data is in fact available for one of these New Towns. In 2011, MWCOG did a geographically focused household travel survey aimed at understanding community scale differences in travel behavior. The chart above shows weekday trips for all purposes, arranged in distance from the regional core. The first five are within the Beltway, and the second five are outside the Beltway, but only Logan Circle is prewar fabric (within the L’Enfant City, even).
For a control, though, I’ll focus on White Flint. Both the Reston and White Flint survey areas have high household incomes, a high proportion of multifamily (49% in Reston, 61% in White Flint), upscale regional retail and substantial office employment at their core, and began development in the 1960s. White Flint has an established Metro line, higher density (6,000 residents/sq. mi.), and smaller households (1.4 average size). Reston’s Metro stop only opened recently, but it has had local and express bus service to other regional centers, larger households (2.2, still small by suburban standards), and generous open spaces that reduce overall density to 4,000/sq. mi. Most importantly, though, Reston has an extensive trail network, while White Flint has better street connectivity.
Sure, Reston has a substantial walk mode share of 14% — more than 50% higher than the regional average of 9%. Yet it’s not much higher than Woodbridge or Frederick, both of which have large expanses of haphazardly planned subdivisions surrounding a walkable “old town.” And it’s substantially below the 18% of trips that White Flint residents make on foot.
Steven points to Boulder and Davis as counter-examples: [T]hat kind of trail network that helps Boulder, CO, and Davis, CA, have high bicycling rates… [Boulder’s] bike map emphasizes their 10% bike-to-work mode share, while in Chicago we can’t seem to nudge past 1.6% (although for some neighborhoods it’s pushing 4.5%).
Yes, extensive trail networks are a great thing to have at a regional level, and certainly have something to do with the relative popularity of cycling in metro areas like the Twin Cities, Denver, and DC. Yet in explaining Boulder or Davis, I’d give less credit to infrastructure and more credit to favorable demographics, culture, and geography — they’re compact, connected, relatively high density, and mixed-use.
Every once in a while, I’ll encounter advocates who argue that trails are the only acceptable environment for pedestrians or cyclists, occasionally pointing to surveys showing that off-street trails are rated in most surveys as the gold standard of bike facilities, especially for those who don’t already regularly bike.
Sure, a trail network is great to have, and should be connected or created at every opportunity. However, we already have a fantastically extensive bike/ped circulation system that touches everyone’s front door — it’s just that our streets are filled with dangerous cars.
Yet the same surveys show that excellent on-street infrastructure is almost as good at enticing people onto two wheels. And since most new development will happen in places that are already built, it’s kind of a moot point, anyways.
Focusing on building up the fabric, and adding the best infrastructure available, is also the approach that Reston and White Flint are taking, and I expect that future household travel surveys will show that the approach will bear fruit for both areas.
[based on an email exchange]
[An entire month without blogging — let’s fix that. This post started with a Twitter conversation about the unusually low peaks in how Montreal schedules its Metro trains, perhaps because it’s not as 9-5 as other cities. A note about the charts: it turns out that I can’t embed Datawrapper charts on WordPress.com, so the ones below are screen caps. Just click on the chart to go the original chart and see the source data.]
Along the lines of “the best transportation plan is a land use plan,” sometimes land use changes can impose huge costs upon the transportation system. As an example, let’s examine how industrial change in central Chicago triggered vast, and costly, shifts in how the CTA arranges its services.
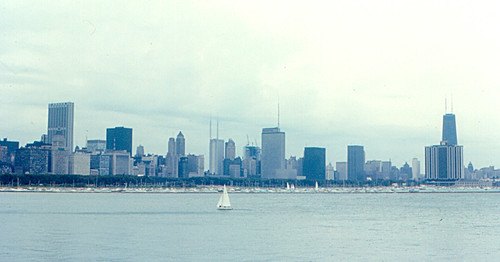
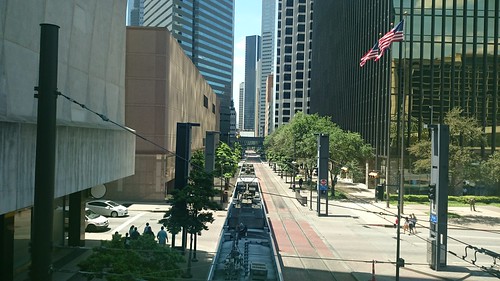
Chicago skyline in 1970
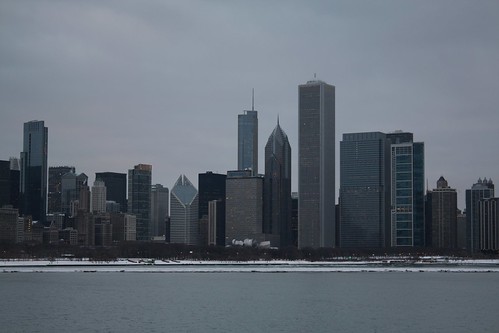
Chicago skyline in 2010 (slightly narrower view)
Popular perception understandably saw downtown Chicago as a boomtown: Enough skyscrapers were built to house all of downtown Philadelphia’s offices, plus all of Glenview or Moline’s residents. Within the high-rises, private-sector office jobs (in business services and finance) grew by 53%. Yet the total number of jobs in Chicago’s Central Area (source) grew surprisingly little in the 1980s and 1990s — by just 10.4%.

The growing skyline masked a sharp decline in nearby industrial jobs. Together, the manufacturing, transportation/utilities, and wholesale sectors lost 42% of their center-city workforce. This bifurcating job market, common to many deindustrializing American cities but occurring on an leviathan scale in Chicago, exacerbated the city’s social divides, plunging some neighborhoods into despair and richly rewarding areas just blocks away.
In short, employers stopped bringing three shifts of workers every day to handle machinery (physical capital), and started bringing one shift of workers every day to interact with one another (human capital). Even if the number of jobs remained the same, the amount of travel capacity needed would triple.
This tremendous economic shift remade the paths of Chicagoans’ daily travel, and to a large extent demanded a reconstruction of the city’s transit system. Despite the Loop’s triumphant skyline, everyday Chicago was for many years a collection of factory towns stitched together along streetcar seams. The factories lined up along the various rail or river routes leading into the city, and the high-level services they required were provided downtown, but their workers came from all over. Terry Clark writes in the essay “The New Chicago School”: “immigrants naturally lived in neighborhoods where they could talk, eat, relax, and worship with persons of similar national background. They would commute even to distant factory jobs to preserve this neighborhood-cultural-ethnic heritage.”
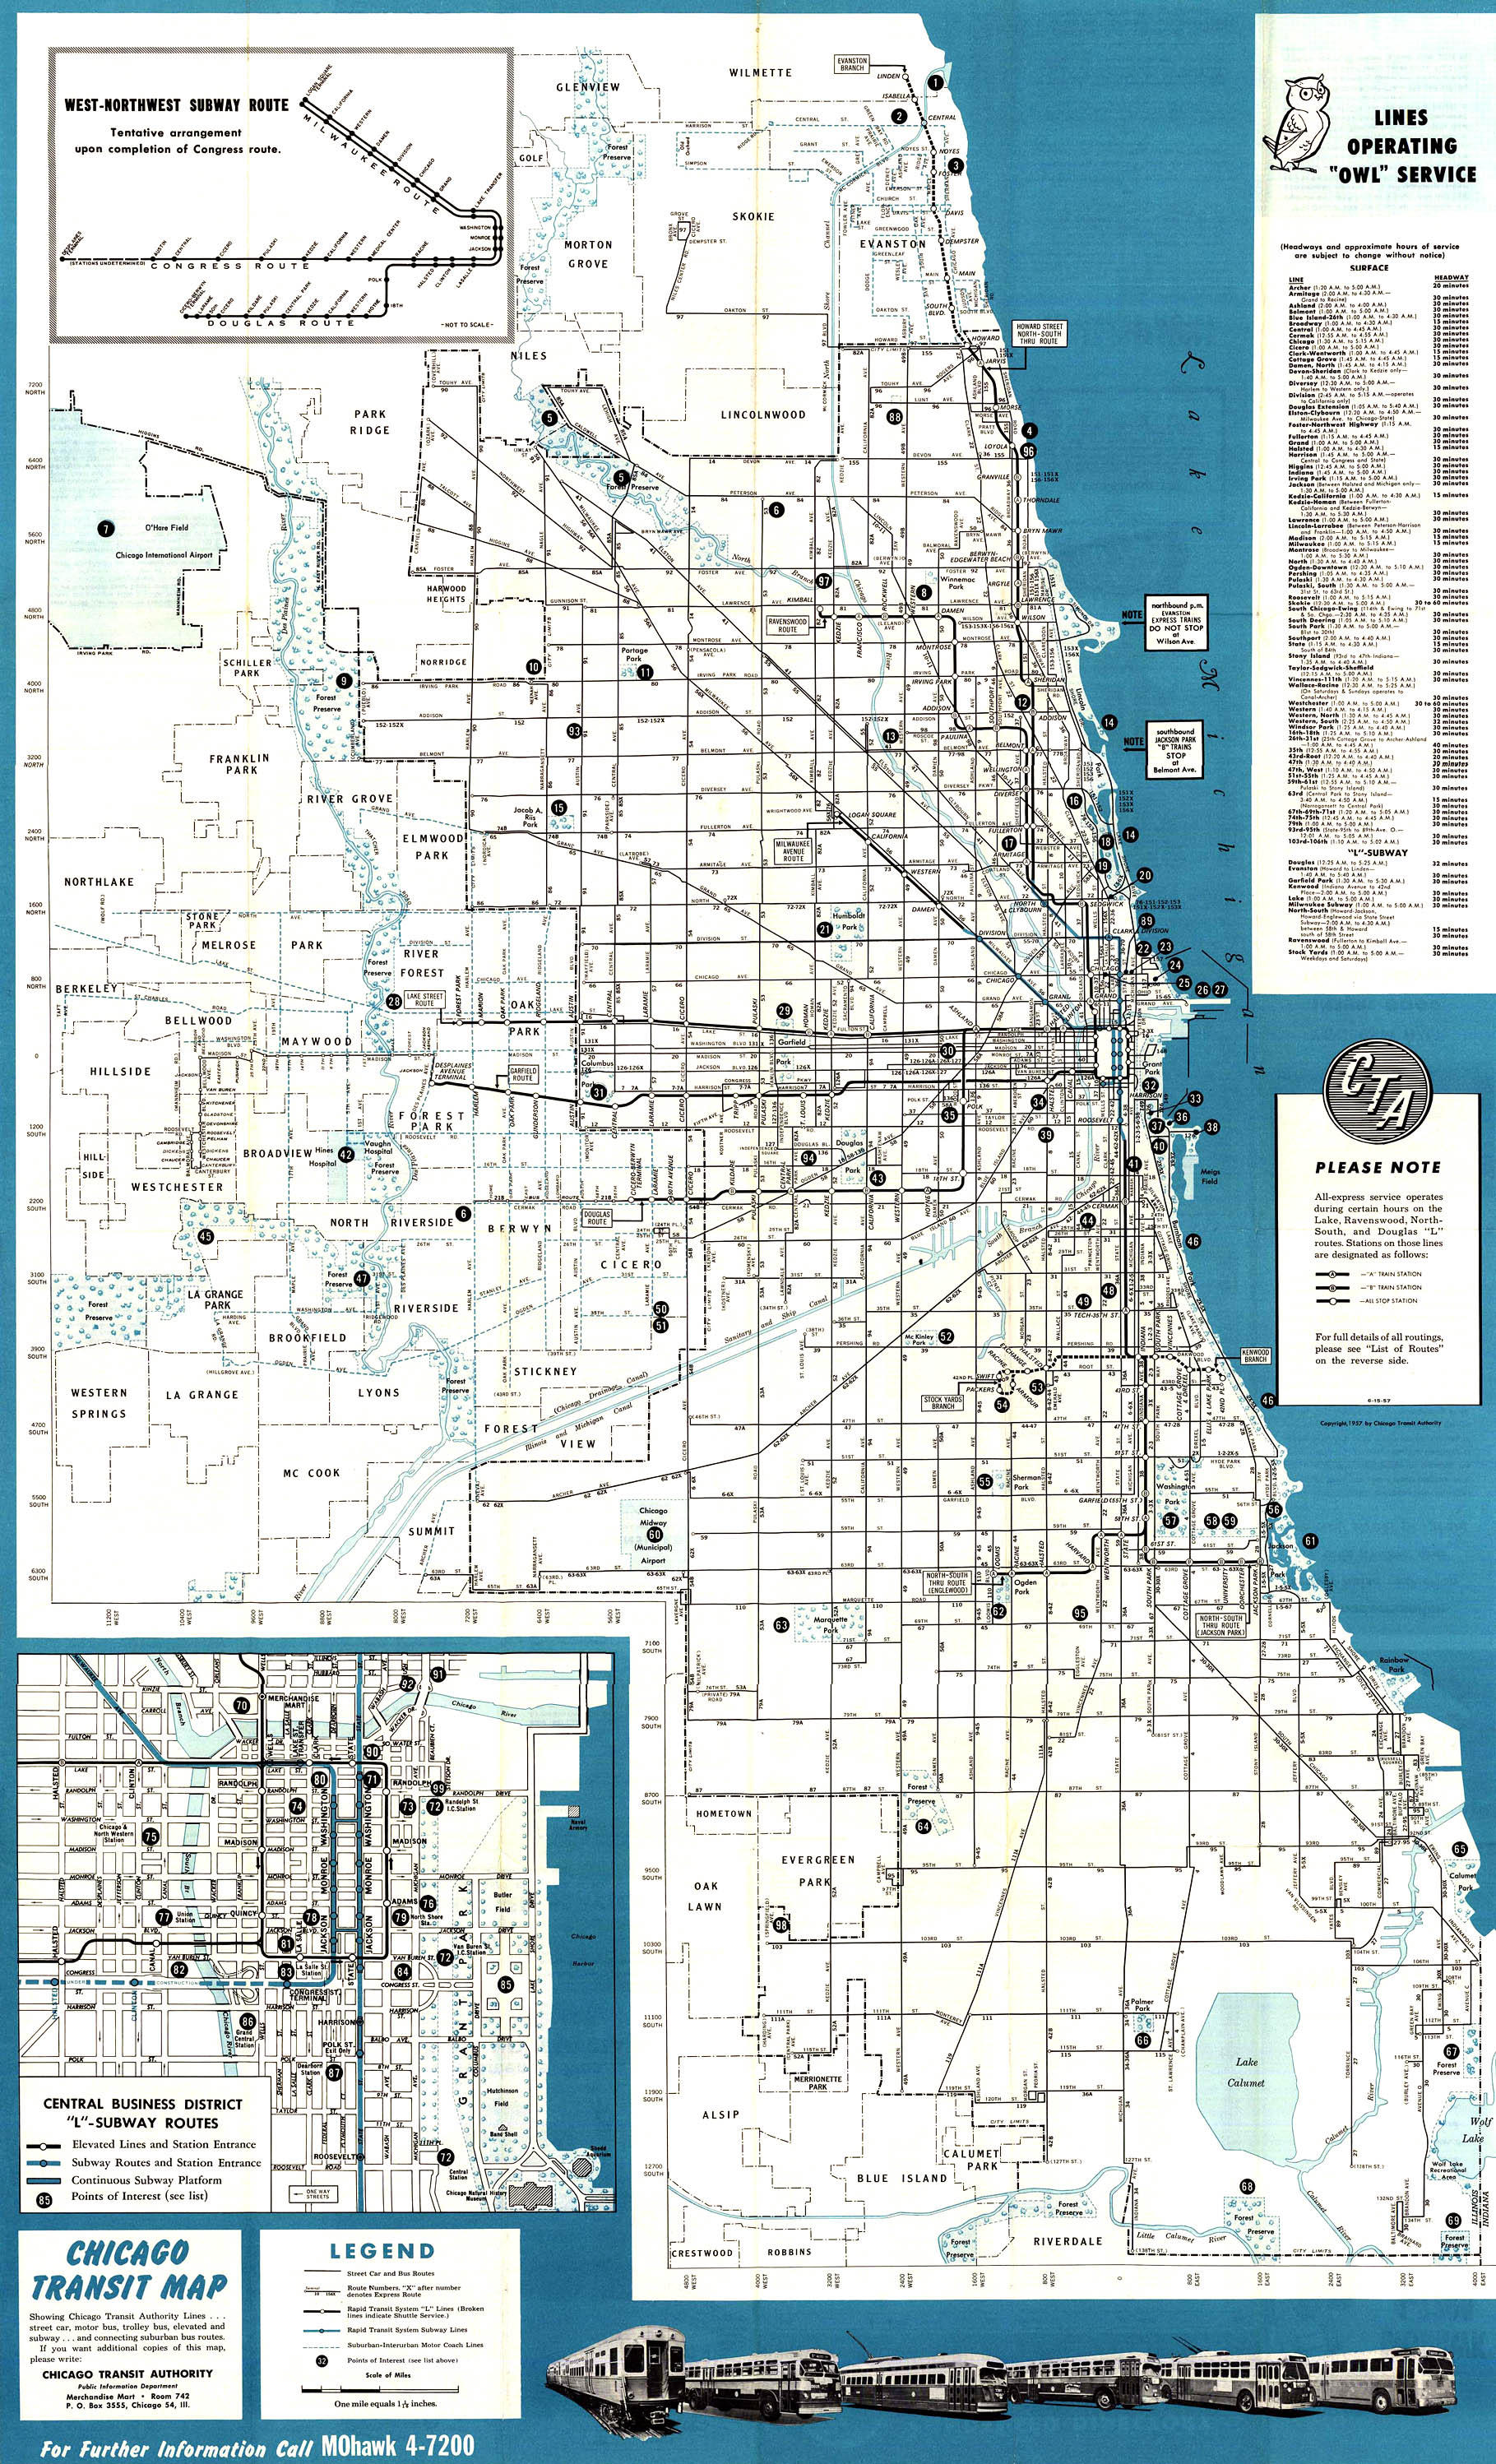
Much of the city’s employment was at three-shift, all-day factories, where workers had to be present all day – because inputs (like shipments of livestock) arrived at all hours, because steam-era machinery can’t just shut off (e.g., a blast furnace can take over a week just to fire up), or because the machinery was expensive relative to the labor and had to be amortized by constant use. As a result, work trips and service levels were remarkably consistent throughout the city and the day; that combined with the city’s grid to create the gridded bus network we all know well. The comprehensive transit system even worked overnight: The 1957 route map lists 69 surface routes and nine elevated lines running all night. Yes, the “L” system did its work of shoveling people into the congested Loop, but even there it only carried 25% of all transit passengers — even to downtown, 75% arrived via the surface lines.
Just like manufacturing, transit is also a capital-intensive enterprise, and having steady ridership all day/all night makes sure that the equipment (and labor) is optimally used. There’s no need to buy streetcars and pay drivers just to shuttle one giant crowd in at 8 AM — and then keep the fleet parked until they leave at 5 PM. Also, it’s all-day transit, not peak service, that enables urban life: as Jarrett Walker writes, “Low-car or no-car lifestyles, in turn, mean that transit has to be available for many of life’s purposes, not just the peak commute.”
The deep spiral of deindustrialization that I mentioned above also changed where and how Chicagoans commuted. Instead of dispersing themselves across the city at all hours of the day — a flow that became better suited to driving anyways — people began piling onto Loop-bound trains for 9-to-5.
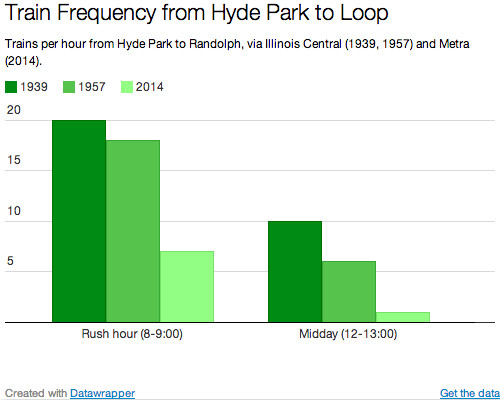
Commuter trains always ran highly “peaked” service, with many more vehicles during rush hour, but these services’ peaks have dramatically grown. The commuter line from Hyde Park to the Loop used to run a 2:1 ratio of peak : midday trains in 1939; now that’s a 7:1 ratio.
Bus ridership, particularly crosstown, dropped off — setting off a vicious cycle of cuts (chronicled by Joshua Mason and Graham Garfield) that reduced crosstown bus service to a shadow of the former streetcar empire. Today’s route map counts a mere 17 all-night surface routes; three-fourths of the corridors that used to have nighttime transit now don’t.
Yet parking buses overnight is relatively easy to do, even though idle capacity is expensive in the long run. What’s been much more difficult, and costly, is adding new capacity to accommodate the ever-larger rush hour crowds, particularly for the growing (Loop-centric) rail system and commuter express buses. Already, CTA spent $530 million on the Brown Line Capacity Expansion Project, which increased train lengths by one-third, and more recently spent over $1 billion on a train order that increased its fleet by 17%. Many of its other planned capital projects, like rebuilding the North Side Main and untangling Clark Junction, will also sink huge sums into upgrading the system to accommodate rush hour crowds.
A small countervailing trend has more recently emerged, though. The city as an entertainment destination — as a site of 24-hour consumption, rather than production — has pushed the system to slightly extend evening hours. That said, the efforts will always pale in comparison to the overnight network that once existed, serving not the few who partied all night, but rather the many who worked all night.
