Today’s McMillan SFS testimony to HPRB

[Testimony given to the D.C. Historic Preservation Review Board this afternoon, in response to the recent HPRB staff report regarding architecture at the McMillan Sand Filtration Site.]

My name is Payton Chung, LEED AP ND, and I am a homeowner in Ward 6.

Thank you for providing this opportunity to comment on the revised master plan for the McMillan Sand Filtration Site. Moving forward with new buildings on this site, in a growing city with a housing shortage and a structural deficit, is the only realistic and financially feasible way to ensure public enjoyment of and education about the historic structures on the site. The proposal will not only, at great cost, stabilize the structure and thus open the site to the public for the first time in a century as a safe and usable park. It will also retain all of the above-ground and substantial portions of the below-ground structure interiors — in addition to the filtration cells that will remain within the park and reservoir lands to the west — while also reconstructing historic landscape elements like the Olmsted walk around the site perimeter, retain the site’s distinctive topography, and weave together the historic neighborhoods that surround the site.

The staff report’s recommendation that the buildings achieve greater architectural unity has merit, given the multiple programs and contexts present within and around the site. Greater architectural unity of the building bases could define the two maintenance corridors as urban rooms, while respectfully framing the sand silos. Similarly, though, it is entirely appropriate that the medical office buildings create an urban space from the auto dominated highway that is Michigan Avenue, and that requires a different architectural context.

Ensuring architectural unity for a site of this scale and complexity is a tall order, but the architects have made a good start and should be allowed to proceed to the Mayors Agent’s review with further guidance from the board.

Again, thank you for your time and consideration.

Towards a unified theory of midtowns

Midtown Atlanta


Downtowns, or central business districts, have been well-studied in the economic literature, but The Metropolitan Revolution is one of the few texts I’ve seen that not only mentions midtowns but posits that they hold the key to future regional economic growth. A midtown typically was a secondary business district that arose to serve the wealthy, uptown residential precincts, and eventually attracted some of the “nice” amenities that wealthy residents wanted to have close to home and away from the congestion of downtown. Yet, as eds & meds employment in particular have boomed, these tranquil bastions have become employment centers in their own right, and perhaps regional economic strategies should zero in on linkages between these areas and other regional economic nodes — and to the likely-interesting neighborhoods around them.

Pages 138-139:

What Detroit Teaches Us

Detroit is drawing a new geography of innovation, tearing down the traditional, artificial borders that have long divided downtowns and midtowns in the United States. Virtually every major city in this country has a strong central business district (mostly for the congregation of government, corporate headquarters, entertainment venues, and some cultural functions), a strong midtown area (where eds and meds and historic museums tend to concentrate), and a state-of-the-art transit corridor, mostly built within the past twenty years, connecting the two. Each of these discrete building blocks brings particular assets that, in turn, provide a platform for a key element of innovation district growth.

They point to Detroit, Houston, Cleveland, and Buffalo as prime examples, and mention Atlanta, Denver, Indianapolis, Minneapolis-Saint Paul, Pittsburgh, Philadelphia, Phoenix, Syracuse, and “even Las Vegas” in passing.

At first, I was a bit taken aback by the certainty of saying that “virtually every major city” fits this pattern, but I can’t think of many that don’t, particularly if one applies a geographically expansive definition to “midtown.” Strong examples include Westwood in LA, Longwood-Fenway or Cambridge in Boston, OSU in Columbus, or West End-Delmar in St. Louis. Sometimes downtown and midtown seamlessly blend with the CBD, as with Foggy Bottom & Georgetown in DC, McGill in Montreal, or Streeterville in Chicago.

It’s also intriguing to think that, with policies and investments directed towards creating a cohesive neighborhood, anchor institutions could be aggregated into a midtown which either never existed or deteriorated due to regional growth dynamics. UIC-Medical Center in Chicago is an obvious candidate; Howard-Washington Hospital Center in DC is another. In that instance, development of the McMillan site creates that missing physical link between the two.

Oh, and this call garners a subtle eye-roll from this generalist, who’s had a tough time monetizing that interdisciplinary knowledge:

[T]he people who deliver innovation districts would constitute a new network of metro builders who cut across disciplines, programs, practices, and professions. Modern society has deified specialists and technicians who diagnose and strive to fix discrete problems–say, traffic congestion or slum housing. Metro builders, by contrast, would be fluent in multiple city “languages”–architecture, demographics, engineering, economics, and sociology–and be cognizant of theory and practice. They would see the connections between challenges and work to devise and implement policies that advance multiple objectives simultaneously.

What Fundrise can and can’t offer

Starting to look like a grocery store
Crowdfunding built this little store.

A few years ago, during the darkest days of the financial crisis, I was the finance director for the Dill Pickle Food Co-op, launching the crowdfunding campaign that ultimately raised enough capital to open what’s now a thriving local institution. I’ve also worked in commercial real estate finance, closely examined how economics and ownership structures affect gentrification, and deeply interested in how to use capital to build authentic places. So I was obviously very interested in what Fundrise was starting here in Washington, D.C., and ultimately chose to invest in their latest project on H St. Their approach has been extensively covered in the media, for instance by Emily Badger in Atlantic Cities and David Lepeska in Next City.

Jonathan O’Connell in the Post offers a different critique: financial advisors who reviewed the offering’s legal documents had strong reservations about its merit as an investment.

My reading of the offering docs concurs with the advisers: The developers, and the large-dollar investors, get preferred classes of stock (and hence voting control, first dibs on returns, and priority in the event of liquidation), plus a guaranteed return via management fees. “The crowd” gets Class C common stock. We small shareholders, in return for our small contributions, ultimately receive no vested control over the project, stand last in line for returns, and stand first in line to be wiped out in bankruptcy.

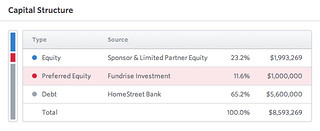
Illustrative Fundrise capital stack

One Fundrise investment‘s capital stack, showing Fundrise’s “preferred equity” (mezzanine) position.

[Update May 2015: As of this time, the majority of Fundrise offerings are currently for “preferred equity.” First, Fundrise itself purchases an equity stake with a stated return, paid either during the investment term or at the end of the term. Then, investors purchase debt backed by that stake — accounting and tax compliance are much easier for debt than for equity. Their offerings also now include a clearer illustration of the capital stack.

The short of it: as is typical with preferred equity, Fundrise investors receive no control, stand second in line for returns (with promised, but not guaranteed, returns), and stand second in line in bankruptcy (with no secured guarantees). In the capital stack illustration, control rests at the top end, risk is highest at the top end, and returns are paid first from the bottom end — debt gets paid first, then preferred equity, then equity gets what’s left over.]

Matt Yglesias in Slate points out that Fundrise can involve its “small-business silent partners” under an SEC regulation “whose main use in the recent past was financing Broadway shows” — and, indeed, I’m reminded of how little control the little-old-lady investors have over Max Bialystock in “The Producers.”

So now that expectations have been suitably lowered, what’s in it for both the developers and the community? Why did I still think this was an experiment worthy of watching from the inside?

A. Cheaper, slower money.

Think about a typical real estate situation: a homeowner with a house. When that house is sold, people get paid in this chain:
1. First mortgage
2. Second mortgage (in commercial real estate, this is a “mezzanine loan”)
3. Homeowner (“equity”)
Risk increases down the chain, but so do rewards and control.

What Class C shares do is to create an equity class with higher risk, lower returns, and no control. This equity isn’t sufficient to forego debt altogether — there’s still a mortgage on the property — but it’s enough to displace high-rate mezzanine financing, and therefore move the preferred equity investors up the chain. Since these loans are generally the highest-cost financing that a developer receives, and usually written with very brief loan terms, they create the greatest incentive to quickly lease the space to a “credit” (i.e., boring) tenant. Common stock is more patient: in fact, we Class C shareholders are so patient that we’re investing without any expectation about when, or even if, we get our money back. In short, it’s similar to a co-op’s membership equity: maybe your money will be there at the end, and maybe you’ll get paid along the way if we choose to declare a dividend, but we don’t guarantee anything and it’s probably easier to think about your equity as a donation.

The reduced cost and reduced “velocity” of capital reduces the developers’ incentive to quickly flip the property, and certainly eases longer-term thinking about the investment. Real estate has an intrinsic susceptibility to wide value swings: construction introduces an inherent delay that prevents supply from quickly aligning with demand, resulting in severe market imbalances throughout the business cycle. Patient capital that can wait out these swings is best poised to profit from true placemaking — hence the family-controlled real estate dynasties that control so much of central New York, London, and Hong Kong.

Yet in this instance, the managers might not take full advantage of their capital’s patience. The offering documents clearly state that the developer plans to sell or refinance the property after a few years, and may well cash out the Class C shareholders at that time. While this may provide Class C shareholders with a conveniently timed liquidity event, five years isn’t exactly a long-term investment in the community.

B. Participation and trust.

Perhaps a bigger — if unquantifiable — benefit for developers is that crowdfunding quite literally demonstrates community buy-in. As Yglesias writes, “A huge network of small-time, commercial real-estate shareholders could provide a much-needed counterweight to the plague of NIMBYs strangling America’s cities.”

Fundrise knows this power, which is why they’ve just floated a project on Florida Avenue that they don’t yet have control over — and even though the terms of the RFP appear to give the edge to another, conventionally financed project team. By letting residents “vote with their dollars,” Fundrise thinks that they can level the playing field between the big, bad developer and the little community. They also benefit from a broad shift in whom we trust: Americans have declining trust in institutions (government, developers, banks) and a technology-mediated concomitant increase in trust between individuals (e.g., Kiva for loans, Lyft for hitchhiking). Instead of just complaining, a well-capitalized community can act on the mantra to “be the change you wish to see in the world.”

In the context of gentrifying Washington, D.C., this strategy might not engender unlimited goodwill: the crowd looks too much like both Matt Yglesias and me: quite heavy on the “myopic little twits” of local lore: young, petit-bourgeois, tech-savvy guys with vanishingly little street cred. In a uniformly gentrified neighborhood like Cleveland Park or Brooklyn Heights or Uptown Minneapolis, “one dollar, one vote” might not be such a big deal, and community finance can definitely tap into the “silent majority” that might desire reinvestment vs. stasis. However, those locales are hardly underserved by conventional finance strategies. Instead, Fundrise is operating in more stratified urban neighborhoods, where banks are still wary of lending against more-speculative land values — and where even a modest capital requirement prevents the venture from truly reaching across the economic divide.

Even the completely community-based Dill Pickle (and other coops like it) encountered resistance by those who viewed it as an agent of gentrification. Not enough resistance to derail the project, to be sure, but plenty of grumbles nonetheless.

C. An opening for even better investment vehicles.

These two reasons — and the idea that, in terms of diversifying my portfolio exposure to real estate, H St. NE is as good a location as any for a 3-5 year speculative play — were reason enough for me to decide that Fundrise was worth a gander. I doubt that it’s really going to take off in a big way: even if its practice is standardized and the market becomes more liquid, crowdfunding still seems like a lot of legwork to raise a relatively small sum, especially given the amount of capital necessary for large-scale urban real estate development.

Fundrise is certainly a great idea, but the lack of community control limits its ability to establish trust in the community development enterprise. Yet it’s an important part of a broader conversation that’s just beginning around using crowdfunding innovations to improve communities. We can try many other tools — some new, some tried-and-true — to give communities greater control and input over their character and future. Cooperative businesses, like the one I founded, are growing all across America, and they play a key role in affordably housing thousands of Washingtonians (including myself). Financial co-ops, better known as credit unions, are quickly growing in the USA — and in some states, they have branched out past basic consumer lending and increasingly lend to or buy equity stakes in small businesses, even at the venture stage. Canadian banking law gives credit unions much wider scope, which allows them to do more for their communities: Vancouver’s Vancity isn’t just a carbon-neutral, living-wage, triple-bottom-line company, it also has $16 billion in deposits (enough to make it the largest or second-largest bank in the context of a similarly sized metro area like Denver or Pittsburgh). Over in Toronto, the Centre for Social Innovation has raised millions of dollars for community-development and clean energy projects through its community bonds. Since they’re bonds, not equity, they can be issued without prospectuses, and can even be held through RRSPs (Canada’s version of an IRA).

Edited to reflect that all Fundrise equity is “pari passu,” and has equal claim in the event of default.

Malls: the long goodbye

Second Floor, Owings Mills Mall

The slow contraction of the market for enclosed suburban shopping malls is part of a long-term trend, exacerbated by the credit crunch. I found a 2005 report from the International Council of Shopping Centers (hardly an anti-mall bunch!) that included a very noisy graph of shopping mall openings over the years. I chose to smooth the curve by (arbitrarily) calculating three-year moving averages instead, rounded to the nearest whole #:


1987-1989: 10
1990-1992: 15
1993-1995: 6
1996-1998: 6
1999-2001: 5
2002-2004: 4


The steep decline from the early ’90s occurred despite bubbly, credit-happy economies in the late ’90s and mid ’00s. Also, keep in mind that malls take several years to finance and build, so arguably developers quietly began aborting mall proposals around 1990, when the power center began its meteoric rise (and subsequent decline; Emerging Trends 2013 ranks them as the worst property type to invest in). The numbers since then (also from ICSC and from press reports) have been just dismal, both before and after the 2008 crisis:


2005: 2
2006: 1
2007: 0
2008: 0
2009: 0
2010: 0
2011: 0
2012: 1*


Even in a recent article trumpeting “Return of the Mall!,” Retail Traffic magazine admitted that “there is little, if any, room for new enclosed regional mall development… Even prior to the current downturn, the U.S. mall market was near the point of saturation. During the 1970s, the heyday of the mall, U.S. developers delivered a total of 375 million square feet of new space. By contrast, in the 2000s, new mall deliveries fell 62 percent, to 144 million square feet, according to research from CoStar.” The best that the article can muster is that trophy malls are still prospering, and that other shopping-center categories have been hit by bigger sales declines. Personally, I don’t know if that’s saying much; I’ve always thought that power centers were most vulnerable to online shopping — out-competed on price and selection (the only selling points of big box) — and we’ve seen that with the recent collapse of many big-box chains.

 
Given the number of malls that have closed — over 40% of enclosed malls built even in the DC region have shuttered — malls have been trending in reverse for almost 20 years now. They were sputtering in the mid/late 1990s, and over the 2000s I’d bet that many more have closed than opened. This isn’t some short-lived, newfangled fad, this is a seriously big shift in how Americans shop (and, in a consumer society, live).
 
Retail may have been the first property sector to see a huge momentum shift away from Edge Cities. Now that momentum in the residential and office markets** has shifted away from the suburbs, it’s hard to argue that drivable suburbia is still what Americans demand.

* City Creek Center in downtown Salt Lake City replaced two enclosed malls that had failed. Net mall count was still reduced by one.
** Emerging Trends ranked “severely handicapped” suburban office the second-worst investment. Just as with malls, this trend is a long time coming: nationally, suburban office vacancy rates used to track downtown office vacancies, but decoupled in 1998 and have stubbornly remained about 5% higher through peaks and troughs ever since. Similarly, the best housing investments were ranked as infill/intown, senior, student, and affordable, with golf course communities and master-planned resorts ranking a shade above “abysmal” as the absolute worst property subsectors to be in.

An alien notion: 800,000 D.C. residents

How was it possible to fit over 800,000 people within the boundaries of the District of Columbia back in 1950?

My, what spacious quarters you Earthlings have

Copyright 1951 Twentieth Century Fox

The 1951 sci-fi classic “The Day the Earth Stood Still” inadvertently shows us how. Klaatu, an extra-terrestrial emissary and nuclear-free advocate, escapes captivity at Walter Reed Army Medical Center and wanders down Georgia Ave. to try and disappear into everyday D.C. To do so, Klaatu checks into a boarding house at 14th & Harvard in Columbia Heights. Each room houses one or two people, and as such there’s scant privacy to be had: everyone overhears everything. This is convenient for Klaatu (at left, in disguise), who knows little of Earthlings’ simple ways, but probably annoying for the Earthlings.

Crowded conditions like these were common in District homes at the time. The 1950 census found 14.1% of the District’s 224,142 occupied housing units to be overcrowded (with >1 person per room). By 2011, that figure had fallen two-thirds, to 4.7%; back in 1950, 5.3% of homes were extremely overcrowded (>1.5 occupants per room).

This crowding meant that on average, every apartment and house in D.C. had one more person living inside: households were 50.2% larger! In 1950, 3.2 people occupied each dwelling unit. In 2007-2011, the number of persons per household had fallen to 2.13, so the city’s population still fell to 617,996. That decline would have been much steeper had the city not built 74,760 new housing units: the city’s population would have plunged to 477,422, and the nation’s capital would be less populous than Fresno.

As the city gets reacquainted with the notion of population growth and begins to plan for a much larger population within the same boundaries, we’ll have to have a realistic conversation about household sizes and housing production. A change of just 0.09 persons per household means the difference between planning for 103,860 or 140,515 additional housing units,* for 35% or 47% more units. That amounts to 2,000-3,000 additional units per square mile of land, after subtracting the 10.5 square miles of parks and 7 square miles of water from DC’s 68 square miles.

Klaatu, unfamiliar with our contentious Earth politics and “impatient with stupidity,” might propose to build a platform of five-units-per-acre suburbia above the existing city, or require every second or third home to be subdivided, or return to 1950s household sizes and require every home to take in one boarder (and not necessarily fugitives). But since Klaatu is no longer with us, we will instead have to figure out more complicated ways of infilling a built-up city.

We’ve obviously figured it out before; after all, D.C. has added an Alexandria’s worth of housing units to its existing housing stock since 1950, plus plenty of offices, museums, hospitals, parking garages, and the like. A lot of that change has happened around places like 1615 M St. NW, the address where a 1954 radio version of “The Day the Earth Stood Still” placed Klaatu’s boarding house. Today, 1615 M is a nine-story Class A office building that brackets the historic Magruder and Sumner schools. The area above K but below Massachusetts was a high-density mixed residential area in the 1950s, what Park & Burgess would’ve known as “the zone in transition,” but today the height-constrained CBD has spread north to Massachusetts. Yet in fact many foreign visitors still board on that block, at the Jefferson Hotel and the University of California’s Washington Center.

Unlike in the movie, there is no way that Klaatu can make D.C.’s growth “Stand Still,” and so the built fabric of many other D.C. neighborhoods will have to change in the near future. Thankfully, neither is there a violent Gort parked on the Ellipse who will destroy the earth with laser-beam eyes if we don’t all just get along.

* Based on this 2006 Urban Institute/Fannie Mae Foundation report by Margery Austin Turner forecasting 100,000 new residents, a target that the Sustainable DC Plan recently raised to 250,000.
** Not to spoil anything, but the Earthlings outside the boarding house extend plenty of Cold-War-era-Earth-y hospitality.

Wider fronts in the not-war on cars: the East Coast & the world

More data points that I’d meant to post in last week’s update from the trenches:

1. Doug Short has graphs of population-adjusted VMT going back to 1971. Interestingly, most of the decades seem to see pretty steady growth, with growth rates (relative to 1971, so not even accounting for the larger base) declining in the 1990s, leveling off in the early 2000s, and beginning a sharp decline thereafter. The cumulative effect of that curve? Americans drive about half as many miles as would have been projected in the late 1980s, based on the fast-growing trend line at that time. Time to shred all those old highway plans, folks! (Via Brad Plumer‘s latest post on VMT trends)

2. A bunch of papers and videos from the OECD on driving trends in the USA, France, Netherlands, Mexico, Japan, and Australia. (Also via Plumer.)

3. “Gasoline demand stayed flat in states bordering the Gulf of Mexico or in the Rockies. But on the East Coast, it has slipped 10% below its peak level…. it has accounted for half the overall drop since the [peak]… The more striking trend: East Coasters are simply driving less. Vehicle miles traveled in Northeast and South Atlantic states in the year ended in March were 4.2% lower than in the same period ended in September 2007. In the rest of the U.S., they are down just 0.5%.” — Liam Denning, WSJ

Vehicle mix also factors in: “Real Americans” are 2.62X more likely to buy pickups than us effete eastern elitists, and 11.6% less likely to buy a hybrid car, but I doubt that vehicle mix has changed enough over the past few years to explain the differing outcomes.

4. I took this photo in 2005; it was in 2004 that the VMT trend began to sputter. In 2013, the gas station has closed, and a Tesla dealership opened across the street. So yeah, it’s tough to be in the gas biz these days.

$4/gallon, here we come!

5. Of course, Todd Litman from VTPI is always more comprehensive about this topic than anyone else. Here’s his 30-page take, which he updates frequently.

6. Contrast these data points to the comparatively rosy (for carmakers, and therefore awful for the planet) scenario recently posited in the Economist:

One reason for concern is that half the world’s population now lives in towns and cities, which have only so much space for cars… Young urban residents may also be meeting up less often in person, thanks to social-networking sites that let them keep in touch digitally. So they have less need for a car… In particular, the generation who came of age after 2000, the so-called “millennials”, express a preference for having access to rather than owning cars…

[S]tudies also show a marked rise in the proportion of elderly people with driving licences. Baby-boomers pretty much all learned to drive, and now that they are beginning to retire they expect to continue motoring. The development of assisted driving, followed one day by fully automated cars, will allow them to stay mobile for much longer.

What may be happening in rich countries is a one-off shift in the timing of people’s driving careers, so that they start later but then continue well into old age. This may be no bad thing for carmakers… So it is not clear that declining car ownership among young urbanites will have more than a marginal effect on overall car sales….

All in all, “peak car”—the point at which worldwide demand for cars will stop rising—still seems quite a long way off. In the rich world some of the economic factors that have deterred young people from taking up driving will fade away: as cars become increasingly self-piloting and accident rates fall, insurance costs should decrease, and in time there will be little or no need to take expensive lessons.

Perhaps true, but retirees generally don’t travel very far, and VMT/capita drops off considerably at retirement. Crowded cities in developing Africa, Asia, and Latin America have less potential for car growth, and have arguably embraced many transportation innovations faster than the rich world has.

Metro DC’s not that rich (for the most part)

Western Avenue
Western at Wisconsin in Friendship Heights: not Madison Ave. by a long stretch

Nate Cohn in the New Republic addresses a factoid that really bugs me: metropolitan Washington is not the wealthiest region in the country, because sums, means, and medians are all quite different things. Rather, the surprisingly high median household incomes posted by many suburban jurisdictions here reflect a large upper middle class of dual-income white-collar families, rather than the very spiky (higher average, lower median) incomes that one finds in New York City or Chicago (or, perhaps even more strikingly, metro Chicago).

Compare, for instance, the Gini coefficients for income (derived from 5-year ACS):
Central jurisdictions
New York County (Manhattan): 0.60
District of Columbia: 0.53
Suburban jurisdictions
Fairfield County, Conn.: 0.53
Hudson County, N.J.: 0.48
Prince George’s County, Md.: 0.38
Loudoun County, Va.: 0.36

For the suburban jurisdictions, that’s the difference between Brazil or Zimbabwe-level inequality in NYC suburbs vs. Japan-level inequality in the Washington suburbs. Despite the District having worse income inequality than any state,* the region as a whole ranks 82nd among top-100 metro areas in income inequality.

This broad equality also contributes to the region’s general good performance on other economic metrics. Despite the extortionate cost of housing locally, proportionately high incomes for the middle class mean that the cost of living is about as reasonable as in Des Moines. A preponderance of well-paid jobs makes the area the most productive in the USA, as the returns on labor are pretty broadly distributed here.

This particular factoid is a favorite of those who trot out the tired “Boomtown DC, growing fat on your tax dollars” GOP talking point. That would have been a correct storyline back when Virginia defense contractors were getting rich off of Presidents Reagan & Bush(es), but it doesn’t quite hold today for various reasons. Besides, those complaining might take a closer look at how wealth elsewhere ultimately stems from federally directed subsidies from “the rest of us”: boomtown Houston flourishes only through vast implicit subsidies to untaxed, unregulated carbon pollution, and booming NYC (with more cranes building more flats for the superrich than anywhere else in the USA) is fed by a federally bankrolled financial industry.

Incidentally, anyone who is looking for the super-rich around here shouldn’t look along the Red Line. Wisconsin Ave. may have “Gucci Gulch,” but besides its relative lack of ostentation (a clue that the real money in America is elsewhere), it’s not nearly as exclusive as the sensitive watershed to its south. Stephen Higley locates the real gold coast along the Potomac gorge: the storied Embassy Row — so named because many of its Gilded Age mansions now house chanceries — of Massachusetts Ave. and its Maryland extension, River Road, plus their Virginia counterpart of Georgetown Pike.

* Typical disclaimer: D.C., as a wholly urbanized place, is not comparable to any state. Urban areas usually have higher inequality, since the very wealthy generally earn their living only within metropolitan economies.

The Metro Way to more of Arlington & Alexandria

A few weeks ago in class, some classmates and I made this firmly tongue-in-cheek PowerPoint in support of the Metro Way bus rapid transit system that will launch soon in Arlington-Alexandria’s Route 1 corridor.

Jokes and !!!!!!!s aside, one useful idea contained therein makes BRT a particularly compelling idea for this half-dedicated-ROW corridor: its extendibility. Metro Way not only has its dedicated ROWs within Crystal City & Potomac Yards, but also relatively free-flowing limited-access roads at its north end. Thus, limited-stop route extensions can connect Crystal City to numerous transit interchanges:
– North to the Pentagon bus interchange
– North along 110 to Rosslyn, which might make up for lost Blue Line service between Pentagon and Rosslyn
– North along Washington Blvd. to Clarendon, if demand warrants an Arlington crosstown express
– Southwest along Shirley Busway to Shirlington, perhaps through-routing with future Shirley Busway BRT service through Shirlington to Beauregard

In addition, extending the routes several blocks south from Braddock Road would bring BRT service to either Old Town/Market Square or King Street Metro — the latter a connecting point not just to DASH but also the Richmond Highway express bus.

Retail = restaurants in 2013

axis
Findlay Market in Cincinnati, always a great place to buy food

It’s not just you: nationwide, what’s opening on Main Street is pretty much only restaurants. To quantify this hunch, retail consultancy Terranomics compiled expansion plans from numerous chains and found:

40% of new retail unit openings will be restaurants… there really are not an enormous number of options out there for landlords looking to backfill smaller shop spaces… There is only one segment of the market where we are seeing aggressive growth plans from inline users and that is the restaurant sector… As e-commerce increasingly competes with the bricks-and-mortar retail landscape, shopping centers will find themselves insulated against those technology driven shifts by beefing up dining and entertaining options that do not compete with the internet.

Yes, we’d all love to be able to walk to the corner and buy some bolts from a corner hardware store, or socks from an apparel shop, but let’s face it: not enough of us do that often enough to sustain very many such businesses, particularly in areas that don’t have enough foot traffic to guarantee significant cross-shopping. Such uses will increasingly congregate within metropolitan subcenters — probably focused on today’s fortress malls or midtown destinations — so there will be winners and losers among retail nodes. At least everyone will have someplace to eat, though.

(BTW, connectivity to those subcenters will be necessary from ever-wider catchment areas. This will require rapid transit, not just walk accelerators like streetcars or bikeshare, in order to connect neighborhoods to retail focal points.)

What will those centers look like? A new ULI report by Leanne Lachman and Deborah Brett (complete with a cover image of a yarn-happy hipster using Square to buy a single-speed cruiser bike) suggests the following tenant mix to keep a lifestyle center — a format designed around Boomer women — relevant to Millennials. I’ll stifle my giggles.

  • a broader choice of eateries;
  • apparel brands favored by Gen Y (such as J. Crew, Old Navy, Forever 21,
    H&M, Zara);
  • a gym;
  • hair/blow-dry salons;
  • Trader Joe’s and green grocers;
  • a bike shop;
  • a pet store and/or a dog run; or
  • uniquely local offerings.

Third places are surprisingly important, with restaurants nearly rivaling homes as gathering locations:

Favorite places to get together with friends (pick three)
At home—my place or theirs 66%
At a restaurant 59%
At a bar 30%
At a shopping center 28%
At a coffee shop 22%
At a park/the beach 20%

(There’s also this amusing mental image: “Hispanics’ propensity to go out for weekend brunch is especially notable. Brunch is also more popular in the South, where 20 percent go weekly, and among downtown residents, with one-third saying they go for brunch each weekend.”)

Behold: a historic parking lot?

Town Center Towers

I really try not to let these things annoy me, but the facts of this particular case just leave me dumbfounded. Last week, my local ANC meeting was filled with condo dwellers so angry over losing their views that they are attempting to use the historic-preservation process* as an end run around development. Yes, I’ve not only seen this movie before, I’ve starred in this movie before.

The most obvious flaw in their reasoning: it’s legally indefensible. The proposed PUD is a mirror image (two 11 story towers at the corners, low townhouses in the middle) of a PUD approved by both the city and the HPRB on an identical site one block away. (The photo is of the mirror site’s north parking lot.) Approving one plan, but rejecting an identical plan, would be the very definition of “arbitrary and capricious,” and therefore illegal, zoning.

Opposing the PUD is also a bad idea in practice. By-right zoning (R5D: 4.2 FAR, 90 ft. height, 75% lot occupancy) permits a wider, larger, but shorter building on the parcel than the one proposed, which would impair their views even more. Even though one neighbor dismissed this as “more empty threats,” there is legally nothing that can stop a by-right development. The developer should opt for taller, thinner buildings, because they still own (and rent out) one of the two impacted towers, and it’s in their interest not to impair their own property’s views — i.e., they have as much to lose as the condo owners.

Besides, the subject property is an appropriate location for a high-rise. It is a pair of 40-year-old parking lots, one 300′ (1/18 of a mile) from a Metro entrance, with two bus stops adjacent, surrounded by high-rises. The location earns 21 of 27 possible points under LEED-ND‘s Smart Location & Linkage section and 21 of the 29 points in the major Neighborhood Pattern & Design credits, #1-4. It’s impossible to do a full scoring without knowing more about the building design, but based on those credits, its location and program put LEED-ND Platinum (passing score 73%) well within reach.

Not only is the location appropriate for infill, the density is hardly excessive. Even with ~2,000 additional units proposed by Bernstein, Fairfield at Marina View, Sky House, and the NW/NE buildings at Waterfront Station, plus the 512 units between the four Town Center Towers, the gross density of the 31.4 acre Town Center superblock is still under 80 DUA [plus <1 FAR of commercial & civic buildings]. Heck, that’s walk-up density.

Infill developments that replaced urban renewal-era open spaces have improved property values, appearances, and amenities nationwide: in Boston’s West End, Portland’s Lloyd Center, Los Angeles’ Park La Brea, Battery Park City, even just to the north at Potomac Place Tower. Similar developments have even won awards from historic preservation groups. Attracting more shops, services, and residents to Southwest will dramatically improve the entire neighborhood’s property values, and provide homes for thousands in a growing city.

If this sets a precedent that even incidental open spaces surrounding old buildings are equally historic, then hundreds of now-historic buildings that form the fabric of our city could never have been built: not just Modernist examples like Tiber Island’s towers surrounding Law House, or the AIA headquarters that embrace the Octagon House, but even the Old Executive Office Building, DC’s courthouses, and the Mall’s museums (contrast this 1851 map to today’s built fabric). Or the striking, and now lauded, Arena Stage expansion shown above. Cities change, and the best cities have built fabrics that weave together collaged layers of history instead of freezing everything at one arbitrary moment in time.

I can’t knowledgeably comment upon what I have heard or read about the he-said, she-said back-and-forth regarding who signed what agreement or who threatened whom with nastygrams, but the offering contracts’ “not to impede… the further development” clause do not leave the homeowners with much negotiating room.

* For most communities, the only court-approved legal maneuver that allows a government to act as taste police. In DC, we also have the CFA, and back in the day Berman vs. Parker implicitly granted the Redevelopment Land Authority sweeping powers over aesthetics.

The Planning Fetish: Comprehensive Plans

A guest post by Jennifer Hurley AICP, CNUa, PP, sent via channels affiliated with CNU NextGen. Although I didn’t write this, I agree wholeheartedly based on my experience working in several cities with varying degrees of commitment to comprehensive planning.

Planners have a fetish about comprehensive plans. Their belief in the power of comprehensive plans and their obsession with creating comprehensive plans illustrates what anthropologists call “magical thinking.”

Comprehensive planning as taught in most planning schools is a failed institution. I’ll pause for the collective gasp. Unless required by state law, most communities undertake a comprehensive planning process rarely, if ever. For years, planners have bemoaned this state of affairs—if people only understood what we do and how it benefits them. To address the lack of interest in comprehensive planning, planners have taken a marketing and education approach, trying to persuade people that we have a product they need.

But the market is telling us something. Maybe we should listen. If comprehensive plans were truly useful and a good return on investment, communities would presumably clamor for their creation. So why don’t communities “do” comprehensive planning?

Comprehensive Planning is too expensive. Being thorough in scope, data analysis, public participation, policy formulation, and urban design is incredibly expensive. It takes a great deal of technical expertise and time. Only a few communities can afford to do it at all, and even those only occasionally.

Comprehensive Planning is exhausting. In addition to the expense and exhaustion, comprehensive planning is no fun. Planning staff, public officials, and the public experience burnout. Once they complete the plan, they don’t want to touch it again for years.

Comprehensive Planning is not effective. Most comprehensive plans sit on a shelf rather than motivate people to action. The thoroughness of comprehensive plans means that few people have the time or attention to read the document, and no one uses it as a ready reference. Planning Departments often specify in Requests for Proposals that they want a plan that is “implementable”, gets used, and does not “just sit on a shelf.” They know what they do not want, but they do not know what to ask for in its place.

How can planners overcome these weaknesses in conventional comprehensive planning? The answer lies in understanding “plan” in its verb form rather than its noun form. The “plan” itself is simply a byproduct, not the most important outcome, of good planning. The most important task of comprehensive planning is to develop extensive understanding and not just to include everything and the kitchen sink.

Planners can provide value, improve the communities in which they work, and raise the profile the planning profession by focusing on three basic aspects of good planning.

Visioning: A community, group, organization, etc. needs a shared vision of the future they hope to reach. A vision is what people see when they can imagine that all of the constraints of today have fallen away. The community’s vision is not merely an amalgamation of many individuals’ visions, but something larger that individuals uncover and build together through group efforts. A concrete, articulated vision gives people a goal, a collective sense of direction, and a reason for moving forward through hard work. Achieving that specific vision is not important; in fact, the changing environment almost guarantees that any vision we articulate today will be out of date in the time it takes to achieve it. What is important about the vision is the motivation and collective goal it provides.

Relationship & Community Building: Community and the relationships that make up community comprise the living, breathing organism through which we carry out action. We need to leverage our targeted, short-term planning processes and interventions to build stronger relationships, healthier communities, and organizational capacity. The effects of a planning process reverberate through an area for years, possibly decades. Long after the specific details and data are obsolete, the quality of the experience, the institutions nurtured, and the relationships built through the process shape the future.

Strategic Action Planning: Strategic Planning involves analyzing various aspects of the environment, including physical, social, economic, political, etc., to evaluate how they affect realization of the vision. Action Planning creates a vital roadmap for immediate next steps. Putting one foot in front of the other, over and over again, is the only way things get done. The institutionalization of repeated rounds of Strategic Action Planning transforms planning from its noun form (an occasional process resulting in a static product) into its verb form (an ongoing method for acting in the world).

The world needs planners and planning. We owe it to the communities in which we work to provide effective planning. We cannot allow our blind faith to deprive the world of good planning.

Map: mortgage interest deduction underwrites suburbs

Mortgage interest deduction amounts by ZIP

See those donut holes? Inner-city areas with low rates of homeownership, low incomes (and thus fewer residents who itemize deductions), and relatively lower property values are receiving far less of America’s fattest housing subsidy — the mortgage-interest personal income tax deduction (see previous discussion) — than their better-off suburbs. The sprawl subsidies continue apace.

The bigger picture is that this is a subsidy that overwhelmingly benefits wealthy people who have expensive houses, and big mortgages to match — and thus benefits “coastal elites” more.

Map from the Pew Center on the States’ report “The Geographic Distribution of the Mortgage Interest Deduction” (PDF).