A few possible bike + train itineraries via Amtrak’s Capitol Limited

Harper's Ferry in October

The Capitol Limited rolls into Harpers Ferry, W.V.

The launch of roll-on/roll-off bicycle service on Amtrak’s Capitol Limited makes it much easier for bicyclists to travel the Great Allegheny Passage and C&O canal towpath. Although the train’s mileage is very similar to the trail’s, a look at the mileage charts will still come in handy when planning an expedition.

For instance, one could complete the trip over two (slightly ambitious) or three (light) weekends, rather than blocking off an entire workweek and hoping for no rain. Starting from DC, this might look like:

Capitol Limited schedule

Capitol Limited, 2015 schedule

C&O Friday
4 PM: Amtrak from DC to Cumberland; overnight. (The late departure makes it possible to get most of a workday in.)
C&O Saturday
Bike 85 miles from Cumberland to Williamsport
C&O Sunday
Bike 68 miles from Williamsport to Reston; Silver Line back

GAP Thursday
4 PM: Amtrak from DC to Pittsburgh; overnight
GAP Friday
Bike 76 miles from Pittsburgh to Ohiopyle
GAP Saturday
Bike 75 miles from Ohiopyle to Cumberland
GAP Sunday
9 AM: Amtrak from Cumberland to DC

The trip’s even easier starting from Pittsburgh, since you can roll off the early-morning Capitol Limited and have a full day of bicycling ahead. Here’s an easy-pace three-weekend schedule, involving just one weekday:

GAP (Part 1) Saturday
5 AM: Amtrak from Pittsburgh to Connellsville
Bike back to Pittsburgh (downhill)

GAP (Part 2) Saturday
5 AM: Amtrak from Pittsburgh to Connellsville
Bike 44 miles to Rockwood
GAP (Part 2) Sunday
Bike 45 miles from Rockwood to Cumberland (mostly a fantastic downhill)
7 PM: Amtrak from Cumberland to Pittsburgh

C&O Friday
5 AM: Amtrak from Pittsburgh to Cumberland, arrive 9:31 AM
Bike 60 miles to Hancock
C&O Saturday
Bike 65 miles to Harpers Ferry
C&O Sunday
Bike 59 miles to Washington DC
4 PM: Amtrak from DC to Pittsburgh

For Washingtonians, Harpers Ferry is also a gateway to a great many weekend road rides in the western hills. Begin with the 4PM ride out on a Friday, and an overnight in the old town. The next day, choose between several loop routes near Harpers Ferry, like around Antietam or South Mountain. After one more overnight (no need to carry everything), take the train back the following morning.

Or take the train out on a Friday evening and begin riding back east along the C&O, perhaps spending a night at a trailside campsite or a cabin (Lockhouse 28 and the Bald Eagle Island campsite are 10 miles downriver, bikeable before sundown during DST). Then, head up out of the valley to explore northern Loudoun or western Montgomery counties. Ultimately, either the W&OD or C&O (or even RideOn on Monday morning from Poolesville) offer a return trip into town.

Another, less complete trail links two other cities along the Capitol Limited — Pittsburgh and Cleveland. Here’s how that trip would work as a one-way.

Friday photo: Georgetown Park, in memoriam

Remnant of Georgetown Park mall

The Shops at Georgetown Park opened in 1981 with one of the most exuberant postmodern interiors in DC. Its fantastical neo-Victorian atrium, accented with the requisite brass railings and stamped ironwork, was meant as an elegant escape from the busy streets outside, filled with specialty shops catering to the carriage trade. It’s strange that its loss raised not a peep in such a preservation-obsessed neighborhood, just as postmodernism is starting to gain attention from the preservation community.

This little scrap of the old atrium railing is within a tiny elevator lobby off M Street, next to Forever 21. The elevator is apparently used for Anthropologie’s loading and for its offices, but also has stops on floors that have been abandoned. One of the mall’s skylights is also intact, above the cash/wrap at H&M.

Friday photo: Globalization and the architecture of “triple echo McMansions”

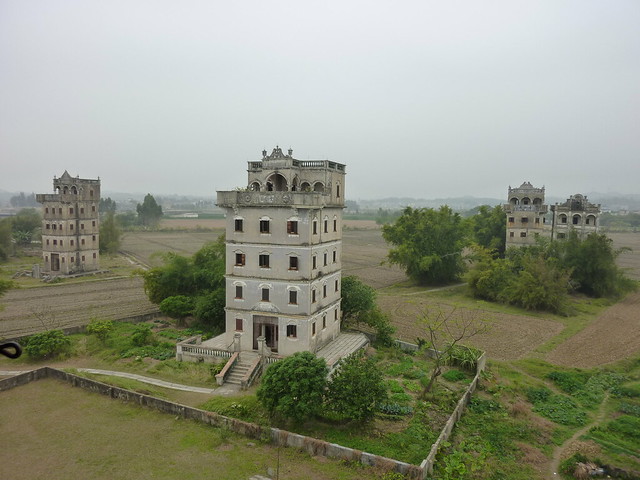
Zilicun fields

Teardowns have recently been making the news in Arcadia, the suburb of Los Angeles where my aunt and uncle have lived for many years. Chris Hawthorne, the architectural critic for the LA Times, wrote that the new mansions are a curious simulacrum of grandiose European houses, carrying on a tradition as old as Southern California itself:

Yet to dismiss [the mansions] as mere eyesores would be to miss a larger story about immigration and architecture in Southern California in an age of globalization. The houses Tong and Chan design represent a triple echo. First, European architectural styles were widely copied in American suburbia, producing thousands of so-called McMansions. Then those styles began appearing in Chinese subdivisions, many of them designed and built by American firms… Their architecture is reassuring to Chinese buyers not just because it suggests American suburban plenty. It also reminds them of newly built and highly sought-after residential architecture on the outskirts of Shanghai, Beijing and Guangzhou…

In the late 1870s, Elias “Lucky” Baldwin, the city’s founder and one of Southern California’s great land barons, hired architect Arthur A. Bennett to design a guest cottage for his sprawling ranch. Bennett’s eclectic design mixed the English Queen Anne and American “stick” styles with elements of Swiss chalet architecture and references to Moorish landmarks and Chinese pagodas. The budget for the house, now part of the Los Angeles County Arboretum, was vast, making it a cottage in name only. With its high ceilings and exterior dripping with filigree, it is as much the product of eclectic architectural influence — and showy new money —- as even the flashiest Arcadia houses by Tong and Chan.

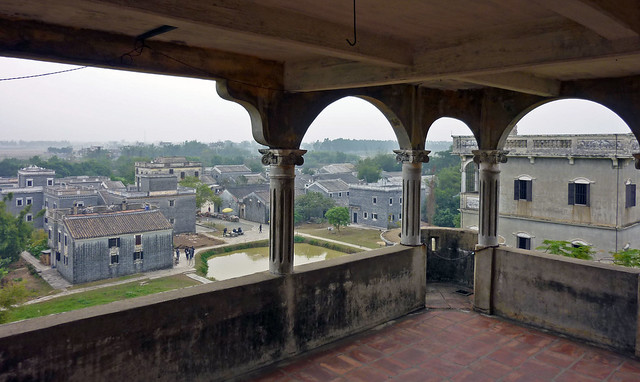
This description brought to mind the most curious buildings that I saw in China, the “diaolou” of Kaiping — the county my father (and his cousin in Arcadia) hails from. Like Arcadia’s new mansions, they look fantastically out of scale, and their mish-mash of architectural revivals certainly don’t match any classical notions of Good Architecture. But sometimes, globetrotting capital manifests itself in less-than-serious ways, and today the diaolou are considered global treasures. From their UNESCO World Heritage Site designation:

covered porch

The main towers, with their settings and through their flamboyant display of wealth, are a type of building that reflects the significant role played by émigré Kaiping people in the development of several countries in South Asia, Australasia, and North America, during the late 19th and early 20th centuries, and the continuing links between the Kaiping community and Chinese communities in these parts of the world.

The big difference between fin-de-siecle Kaiping and 21st-century Arcadia, though, is zoning. America might be “a free country” in many respects, but not when it comes to building houses, as a recent LA Times article by Frank Shyong reveals.

In yet another display of what Mike Davis called “slow-growth Know-Nothingism,” Anglos are using their superior access to the machinery of zoning and local elections to write into law their feelings about “those” people — in particular, changing the zoning code to severely restrict new houses. The people who vote today get to write laws affecting the people who will live there tomorrow, without even knowing or caring who they’ll be.

I used to live in another American neighborhood that’s filled with ostentatious mansions built by immigrants who earned their keep in questionable trades. These days, of course, those buildings are considered local treasures. I’m glad that the Yankee settlers who lived lived there in the 1870s and 1880s, farming and building simple cottages, didn’t have zoning — and thus couldn’t legislate into the built environment their sublimated panic about immigration and social change.

Friday photo: Build in town, not edge towns, to cut carbon

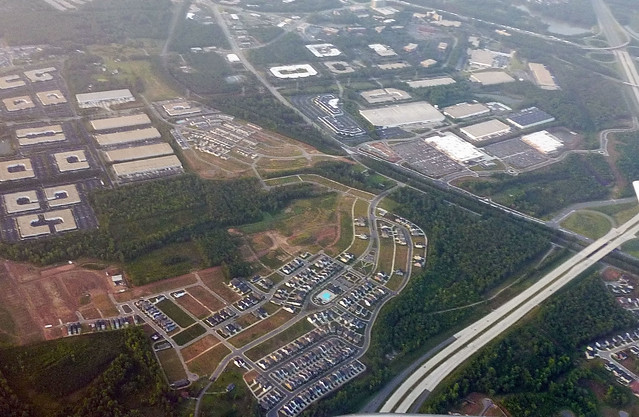
edge town

The results are definitively in: when it comes to cutting carbon pollution from new development, location is far and away the most important factor. Even bad infill development will easily beat even the best greenfield design in terms of avoiding car trips — the single most climate-damaging activity in most Americans’ daily lives.

Kaid Benfield illustrates the point by contrasting the VMT per capita within some of the best suburban and urban neighborhood designs of recent years. Grounding his analysis in research, he writes:

[L]ocation is by far the most significant indicator of how much driving typically takes place to and from a given neighborhood. This is because of something called “destination accessibility”: outlying locations have fewer jobs, shopping opportunities, schools and other typical trip destinations within easy reach than do more central locations, causing average driving distances to be longer. (It is also generally easier in more central locations to substitute transit and walking for what would otherwise be driving trips, but such “mode shifts” are statistically less significant to vehicle miles traveled than are driving trip distances.) As a result, carbon emissions from outlying locations, per person and per household, tend to be higher – typically a lot higher – than those from closer-in locations.

It takes a lot of effort to create new “connected, complete communities” from scratch, since a “complete community” depends upon a myriad of services. When the first household arrives in an incomplete “edge town” (like Kitts Creek, shown above), they may be able to walk to other houses and some services. New services won’t arrive until there’s sufficient population to support them — and in many cases, rely upon people living even further out. Contrast that with a new house within an existing “complete community,” which already has all of that community’s services at their doorstep, from day one.

I’ll note that mode shift is less statistically significant because, outside of a few urban cores where destinations are so close by that walking is enjoyable and driving a pain, driving accounts for a substantial majority of Americans’ trips. That makes development within those few urban cores that much more important, in the scheme of shifting Americans away from automobility.

Thus, the most effective land use tool that urban planners have to address the global warming crisis — and at minimal public cost, to boot — is to make infill development easier.

Applied on a global scale (or even at a citywide scale), the potential is vast: 2014’s New Climate Economy report estimated that “compact, transit-oriented cities” could keep 1.8 billion tons (CO2 equivalent) of global warming pollution out of the air annually by 2050. That’s equivalent to decarbonizing the entire US transportation sector, or the economies of Russia or India.

Friday photo: CIAM’s embarrassing questions about your rowhouse

Jose Luis Sert book: Why is your house gloomy?

Can Our Cities Survive,” Jose Luis Sert’s provocative 1942 treatise on the future of Western cities, posed this set of “embarrassing” questions to residents of the era’s cities. Those who claim that rowhouses are uniquely well-suited for families might recall that, not that long ago, they were widely seen as “gloomy” and unfit for family habitation unless extensively modified — and that most of America still thinks so.

Of course, Sert was largely wrong — in particular, the automotive menace should be solved by restricting the cars, not the children — and the Modernists were never quite successful at convincing families that high-rises were worthwhile.

Attitudes had softened just a bit by 1950, when the regional chapter of the AIA issued a report called “Of Plans and People.” Washington was then in a frenzy over the need to house its exploding population. Rowhouses were merely “disreputable,” rather than intrinsically awful:

Home owners have insisted on increasingly severe restrictions against apartment buildings and row-houses–this despite the fact that for many families they are the most suitable forms of housing. Part of this opposition results from the crude design of these buildings. The ugliness of the typical Washington row-house with its two-story back porches has done more than anything else to bring the row-house into disrepute. If builders were more concerned about good design, the public might feel less need for “protection” against apartments and row-houses.

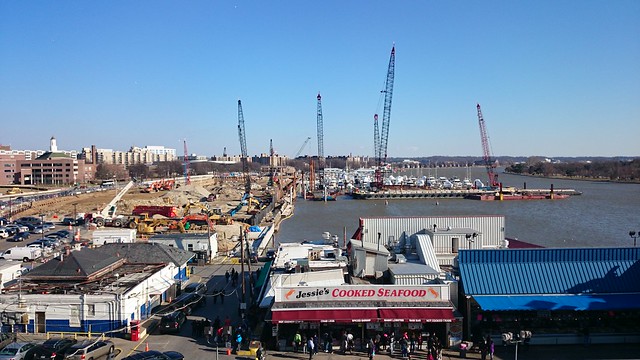
Friday photo: Cranes at the Wharf, from spring into summer

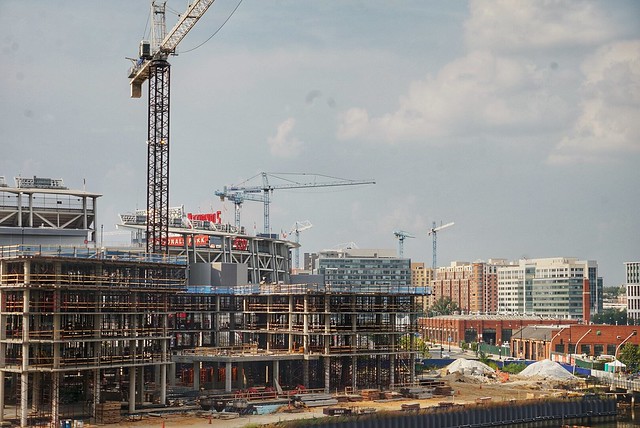
Cranes at the Wharf, 10 July

10 July 2015.

Cranes at the Wharf

15 March 2015.

I’ve been trying out a faux-time-lapse-photo series of the ongoing construction of the Wharf, the mega-project just a few blocks down the street. The photos are taken from the Case Bridge, under the “L’Enfant Promenade, Keep Right” sign.

Since the lower photo was taken in March, the piers have been substantially completed, thousands of foundation piles have been nailed into the ground, excavation has been completed for the sitewide underground parking garage, and some of the first structural supports. Since the site is just about at sea level, substantial pumping will continue to keep seawater out of the hole until the foundation is complete. Two of seven tower cranes have arrived on this side.

Also, be sure to check out my posts at Greater Greater Washington. I used to crosspost all of them, but haven’t done so as much lately.

DC built 13% less housing over the past decade than its own citywide plan calls for

A version of this post was posted at Greater Greater Washington.

Nine years ago, the District of Columbia adopted a Comprehensive Plan to guide planning efforts throughout the city. At the time, the District’s population had just started to perk up after six decades of decline, and the plan reasonably foresaw that growth could continue into the future. Yet even though the District’s population has grown substantially, its housing stock isn’t keeping pace.

Three years before the comp plan was adopted, Mayor Anthony Williams pointed to recent population gains when he announced a bold goal to bring 100,000 new residents to the District within a decade [PDF]. The 2006 Comprehensive Housing Strategy Task Force recommended adding 55,000 new housing units over 20 years (a recommendation reaffirmed by a 2012 housing strategy update). Not only would that figure meet long-term population growth goals (accommodating 114,400 residents at the then-current household size of 2.08), but it seemed attainable: The District issued building permits to 2,860 housing units in 2005.

The comp plan incorporated much of the Housing Strategy, noting in its Housing Element that “The increase in [housing] demand has propelled a steep upward spiral in housing costs, impacting renters and homeowners alike… The housing shortfall will continue to create a market dynamic where housing costs increase faster than incomes.” To address the shortfall, the plan’s very first policy opens with the statement: “The District must increase its rate of housing production if it is to meet current and projected needs through 2025 and remain an economically vibrant city,” and raised the forecast slightly, to 57,100 additional housing units over the plan’s 20-year horizon.

The city as a whole isn’t meeting its goals

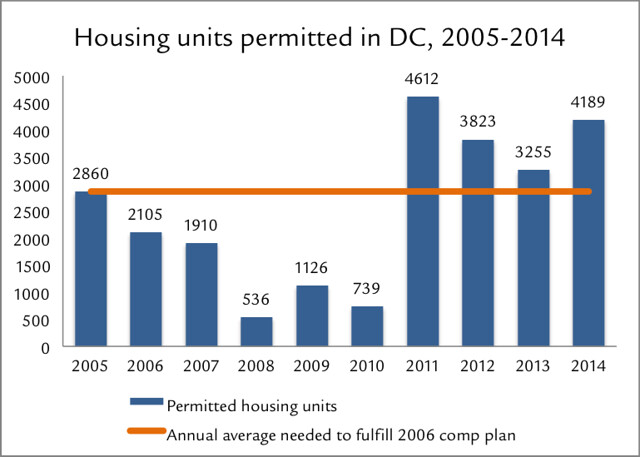
Yet despite all the new construction over the past decade, including two building booms, DC’s currently on track to miss its 2025 goal by 13%. Instead of building 2,855 units per year, DC’s averaged fewer than 2,500 each year over the past decade.
dc permits

The big reason why is that homebuilding nationally came to a near-standstill during the 2008 crisis, and the District was no exception: building permits crashed by 81% from 2005 to 2008, and remained at low levels through 2010. Many proposed projects, like CityCenterDC and Half Street, came to a halt when banks collapsed. Yet all that time, the city’s population, and thus the demand for new housing, continued to grow.

Construction has since rebounded to new highs, with 39% more building permits issued each year between 2011 and 2014 than in 2005. Still, the new boom hasn’t yet erased the 3,000-unit backlog from the slow years.

To get back on track, building permits would have to keep up at recent years’ record-setting pace for at least another three years — and perhaps longer, since the next ten years will also inevitably include another economic slowdown that will subdue construction.

Housing growth has lagged population growth

Even though housing construction has lagged projections, the city’s population has continued to grow. Instead of moving into new housing, all of these new residents have in recent years just filled holes in the existing housing stock.

Vacant units — the slack in the District’s housing market — have steadily disappeared in recent years. Between 2010 and 2013, the Census reports that the number of vacant housing units in the District plummeted by 13,319 (or 31%), far outpacing the 6,850 units that were added to the District’s housing stock.

It’s convenient that so many vacant housing units just happened to be available just when the District’s population began booming, but that feat can’t continue forever. A growing population will, at some point, require new housing.

Indeed, current market indicators show that there’s still tremendous demand for newly built housing: Even though a record number of new apartments have been built, they’re being snapped up as soon as they’re available.

The recent slowdown in the District’s population growth isn’t reason to rest: It could be that slower population growth is a result of inadequate housing growth. Slower population growth largely results from reduced domestic migration, and the #1 reason behind domestic out-migration from DC is because of its inadequate housing. (No surveys track why people choose not to move to DC in the first place, but the reasons are likely similar.)

Yet meeting local environmental goals requires even more population, and housing

David Alpert’s article on Sunday referred to the District and the greater Washington region’s aspirations to a greener future, which require that the District add many more residents. DC’s Sustainable DC Plan, which was adopted in 2012, acknowledges that the District needs to “increase urban density to accommodate future population growth within the District’s existing urban area,” and sets a target of welcoming 250,000 new residents by 2032. That target implies at least 100,000 new housing units, a figure confirmed by recent studies from George Mason University and echoed in the region’s long-range plans.

Adding more residents to the region’s core will result in a substantially smaller environmental impact than adding those residents at the region’s edges. Accommodating more population growth within existing built areas, like the District, reduces the overall environmental impact of new development, and not only by diverting pressure to pave over outlying wildlife habitat and green space.

People who live in dense settings close to the regional core live more lightly on the earth as a matter of course: Residents of the urban core drive less than half as much as residents of sprawling suburbs — a fact that regional transportation plans rely upon to keep traffic congestion, and road expansion, down.

DC can take a fresh look at housing

As Alpert wrote on Sunday, “a great opportunity” to review DC’s housing needs “will come when the District begins the process of revising its Comprehensive Plan.” As part of that review, the Office of Planning should examine the comp plan’s policies in light of the District’s new, more ambitious goals — and the District’s failure so far to deliver sufficient new housing to meet demand.

Yet it’s getting harder, not easier, to build new housing in the District. New zoning restrictions, like the “pop-up ban,” have made it even more difficult and costly to build new housing units in large swaths of the District. Even when proposed developments meet existing zoning, they often face costly and time-consuming litigation.

Since the comp plan guides the zoning regulations, a revised comp plan should guide future zoning changes to make it easier for the District to meet its housing and environmental goals. A revised comp plan should also determine where new housing can and should go; a future post will show how the existing comp plan has fallen short in that regard.
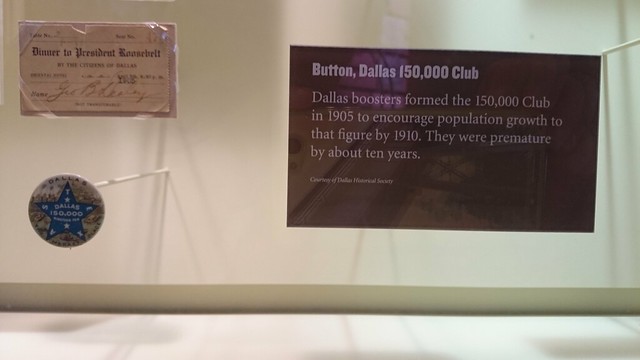
Friday photo: The pre-NIMBY era

Once upon a time, before there were NIMBYs

Once upon a time, citizens’ leagues sought greater population as an end unto itself, knowing that more people would bring more services and more opportunities. Dallas is still famous for its boosterism, but nowadays talk of more growth will probably bring out at least a few complaints about traffic congestion.

(Button seen at Old Red, the Dallas County history museum.)

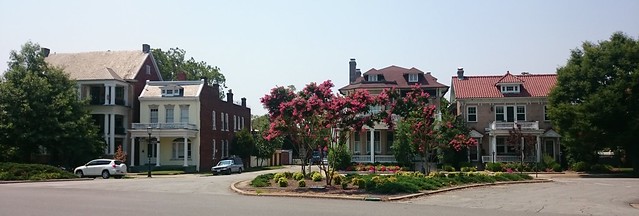
Friday photo: Mixed residential densities vs. single-density zoning

Richmond: around the Fan

Monument Avenue at Belmont, Richmond, Virginia: one, two, and six-family houses, side by side, on one of America’s most famous residential boulevards

Many of America’s most celebrated urban neighborhoods, like the Fan in Richmond, have a fine grain of different residential densities. Neighbors might live in buildings of broadly similar sizes, but at substantially different densities. But the entire premise of American zoning, as established in Euclid vs. Ambler, was to maintain uniformly single-family districts — uniquely among any country, as Sonia Hirt as shown.

The world’s best loved cities are the way they are not because of zoning bylaws but in spite of whatever zoning may now be in place… Serendipity, complexity, conjunction, anticipation, surprise and delight: these very human experiences are what great cities offer. But zoning is a blunt, inflexible tool. Zoning is by definition exclusionary, limiting things to a preordained set of possibilities. It determines what cannot be done, rather than what can be It does not anticipate nor nurture new, untried forms of city-building or habitation. It does not, in short, encourage the city of desire.

So little of the [American] city was built before zoning was introduced that its more deleterious effects are much magnified. There is very little evidence of the organic city, the intricate web of urban spaces and built forms that rose before the heavy hand of zoning was applied. There is no “old town” core of narrow lanes and multiple layers of use. And there is very little unpredictability, no edge. At the risk of sounding simplistic, it is boring.

— Lance Berelowitz, “Dream City” (Douglas & McIntyre, 2005), pg. 223.

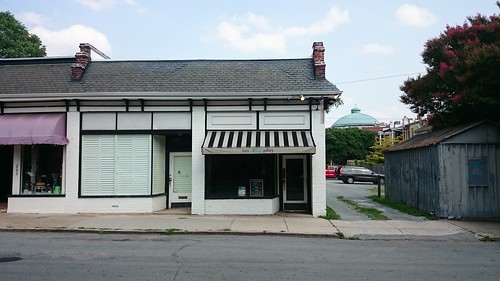
Richmond: around the Fan

Bonus: down the street, an illegal mix of uses. Orchid shops and churches, oh my!

CNU conversations: Retrofitting suburbia, organically?

Asheville

The South Slope area just south of downtown Asheville, now known for its many breweries, had an earlier incarnation as a Motor Mile of auto-related businesses. Before the 1930s, it was mostly small houses.

Now that many cities’ favored quarters have started to run out of pre-war neighborhoods (e.g., streetcar suburbs) to gentrify, the next frontier involves mid-century neighborhoods. Yet the typical cycle of gentrification requires fully depreciated, “aged buildings”,” as Jane Jacobs wrote (and Margie Zeidler marvelously retells).

In these instances, the “aged buildings” — Levittown-era subdivisions, proto-strip malls, little office buildings — suffer from two flaws:

  • An old Modern building can be more liability than asset. The mass-produced materials of that era are often toxic and less-than-durable, and construction quality was sometimes questionable.
  • The density and connectivity are often sub-critical to create a walkable urban place. Infilling is an option, but it is by definition expensive.

Under Neil Smith’s “rent gap” theory of gentrification, these places are doomed to decay and decline until their higher use justifies full demolition and replacement — rehabilitation is hardly even justified. And given the tremendous need to backfill infrastructure, full replacement is particularly costly.

Tactical and modular approaches to infill show some promise at reducing construction costs. To reduce the costs of rehabilitation, certain smaller jurisdictions have thrived through selective non-enforcement of building codes (going beyond a “lean” approach). Even though the very notion of artist-led gentrification began with plenty of code violations, it all seems so much less romantic today.

One possible exception: industrial buildings tend to have flexible interiors, relatively central locations, and (most notably) high lot coverages. In places where their relatively poor street connectivity and access can be surmounted, relatively high job densities could be accommodated within the existing low-rise building stock.

How growing income inequality affects places, part 2: The favored quarter gets richer, the wrong side of the tracks still suffers

The same divergence in fortunes appears to be accentuating price differentials between metropolitan sectors (essentially, “sides of town”). In an economy where the rich are getting richer than everyone else, the rich side of town is also increasing its comparative advantage over everywhere else.

LA office rents

This split was apparent during a recent trip to Southern California. The region might still be “polycentric,” but where one side of town — the Westside favored quarter — now completely dominates local wealth creation. What were merely lopsided prices before have now become absurdly imbalanced, with mediocre buildings on the Westside commanding top rents while perfectly nice areas, like Long Beach and Pasadena, are lagging badly.

In cities where houses or offices on the “right” side of town are scarce, such real estate becomes a privilege only available to the wealthiest people — who, as we’ve noted, are getting wealthier, and in large part because of their houses on the “right” side of town. Even though real estate prices generally track local incomes, the favored quarter of Los Angeles now has prices that track only the exploding incomes of the ultra-rich.

This Redlands ISEA animation of LA-area housing prices from 1988 to 2011, over the course of several cycles, illustrates the “flight to quality” that has occurred during the three busts (mid-90s, early-00s, 2010). At the start, high-value areas are relatively well dispersed across the basin, with only the inner city (particularly the near south and east) suffering from low prices. But, over time, the cumulative advantage of being near the beach increases over time — especially because prices don’t fall as much during the busts, but grow by just as much during the booms.

The trend is perhaps in sharpest relief in high-Gini areas like LA, but is broadly occurring across the country. Joe Light reports in the Wall Street Journal that lower-priced houses are lagging even as prices nationally rebound:

Between January 2006 and May of 2015, the median value of homes in the bottom third of the market has dropped 13% to $101,900, according to Zillow. The median in the middle third is down 6% to $172,600, while in the top third it is off 4.5% to $325,800… The [disinvestment] cycle has been hard to break in large part because low-wage workers have seen little, if any, income growth during the recovery—putting them in weak position to qualify for mortgages.

Recently, Rolf Pendall at the Urban Institute identified the most and least privileged neighborhoods in metro areas nationwide in the 1990, 2000, and 2010 censuses. Over those two decades, the most privileged neighborhoods saw home values rise by an extra $80,000, and their residents actually benefitted from that gain — their homeownership rate is twice as high as in the least privileged neighborhoods. (Since fewer than half of households in the least privileged areas are homeowners, their property value gains accrued to someone else.) Privileged neighborhoods also stockpiled human capital: the growth in their college attainment rate was four times higher than in the least-privileged areas.

This has tremendous implications for intergenerational social mobility, which is closely tied to income, human capital, and wealth. Not only do wealthier families have more private resources for their children, but in a country where schools are largely funded with local property taxes, wealthy communities have more public resources for their children. Three generations ago, legal segregation awarded suburban nest eggs to white families while denying black families the same opportunity — resulting in a “titanic wealth gap” between the races today. (Furthermore, generations of zoning have sought to freeze this status quo, and perpetuate the original injustice)

Thus, the “segregation tax” that penalizes property values in majority-minority communities creates a vicious cycle both for families and for communities, and one that is only getting more pernicious — sadly illustrated recently by the events in Ferguson, Missouri.

Locally, stagnant housing prices in Prince George’s County have contributed to an ongoing foreclosure crisis. Stagnant housing demand from the “underwater limbo” is compounded by its relative isolation from the favored quarter’s jobs engine, and the area’s ongoing “segregation tax” discount. For example, in 1965-1975, the Levitt firm built two large “Levittowns” in suburban DC — Belair in north Prince George’s and Greenbriar in south Fairfax. Even though these are the favored and less-favored sides of their particular counties, near-identical ranches recently sold for an average of $300K in Bowie and $440K in Fairfax.

(An even more striking dynamic can be seen in the Philadelphia area’s twin LevittownsLevittown, PA has property values twice as high as Willingboro, NJ. What’s more, over the 2007-peak-to-2012-trough cycle, Levittown property values declined by only 25%, whereas Willingboro values declined by 50%. And yet, all of the Levittowns began as mostly or exclusively white.)

Meanwhile, formerly moribund downtowns adjacent to job-creating Favored Quarters are finding some success reinventing themselves as the easiest place to add new residential, away from the fierce FQ NIMBYs. The boom in downtown LA’s residential and retail market diverges sharply from its flatlining office market — which still suffers from 20%+ vacancy even though dozens of office towers have been converted to other uses. Downtown Atlanta and Dallas are similarly benefitting from escalating prices to their north.

Friday photo: Greedy developers built your city

Two rental houses on Capitol Hill

I recently came across these plans by a fantastically wealthy land speculator, seeking to profit by ruining DC’s pristine Capitol Hill neighborhood with a towering building crammed full of tiny rental “microunit” apartments for immoral singles — rather than wholesome nuclear families! This kingpin practices his avarice from posh Fairfax County, within a “resplendent” mansion overlooking the Potomac.

This paragon of greedy, out-of-town developers is, of course, George Washington, the very namesake of Washington city. (Yet another greedy developer, Alexander “Boss” Shepherd, is memorialized with a statue right outside the Wilson Building.) Cities don’t arise via immaculate conception; they’re built by developers.

John DeFerrari’s book Lost Washington has a much more detailed account of the houses, showing that the NIMBY nightmare of “out of scale” “overdevelopment” was indeed what this city, and all other cities, was built on. (Otherwise, we’d all still be in caves!) Washington wrote to his architect, “Although my house, or houses… are I believe, upon a larger scale than any in the vicinity… capable of accommodating between twenty and thirty boarders.” A later, even greedier, developer popped up (and popped-under) the ruined buildings in the aftermath of 1814’s fire, and the buildings grew to six stories tall. Anti-pop-up NIMBYs might take heart from its fate: it then descended into criminal infamy and was bulldozed for a park.

[The plans in the photo above are from GW’s Albert Small Collection. More background, including photographs and illustrations of the houses at various points in time, is at Streets of Washington.]