Two perspectives on the future of urbanism(s)

Kentlands just hosted its 25th anniversary celebration, a milestone that now firmly places it among the various New American Towns that dot the lower Potomac valley. In this time, what has New Urbanism accomplished, and where does the future lie? Two perspectives, both from the vanishing world of print-only publications, are excerpted below.

mid-rises

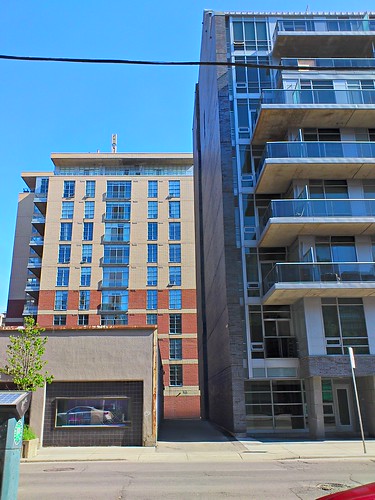
New mid-rises in Toronto.

1. Spacing Magazine‘s 10th anniversary issue (which we [few] American subscribers get pretty late in the game) has a great article by Dylan Reid about “the future of urbanism,” or rather the challenges ahead:

This rise of urbanism is good. It is creating cities that are healthier, more efficient, and more sustainable fiscally and environmentally — and they are more enjoyable to live in. The fact that an ever-increasing number of people actually want to live in dense downtown neighborhoods is an astonishing transformation from two decades ago, and essential to urbanism’s success…

Urbanism’s problems don’t discredit it (although some would like them to); rather they mean that the movement needs to test, challenge, and extend itself rather than rest on its laurels…

Urbanists also need humility. The familiar urbanist solutions work in the older parts of the city and, perhaps, in concentrated blank slates like brownfields, but they won’t work out-of-the-box in the suburbs.

Reid then posits and elaborates upon ten challenges, first as statements and then as questions that elude easy answers, which I’ll quote here [with my clarifications]:

  1. How do we adapt and extend the benefits of urbanism to the suburbs in a way that will be welcomed?
  2. Can we figure out how to build avenues and greenfield neighborhoods that are vibrant?
  3. How do we ensure that everyone is able to enjoy the advantages of urbanism?
  4. How can we ensure that extending rail transit and walkability doesn’t simply push low-income households further away?
  5. How do we maintain viable spaces for creativity, or create new ones, in the face of gentrification?
  6. How do we keep small waterways without undermining the density and connections that make a city efficient and sustainable?
  7. How do we make sustainable local food available and affordable to everyone in the city?
  8. How do we maintain the role of manufacturing and food processing in our urban economy and start to integrate them into sustainable urbanism?
  9. How will we find the money and political will needed to fund the next waves of transit investment?
  10. How can we increase the number of year-round cyclists?

The list is heavy on questions of affordability, inclusion, displacement, and gentrification. While at first these might seem to be concerns primarily for fast-growing cities, they do speak to the need for urbanism to address a broader range of people, which would improve its prospects in slower growing cities as well.

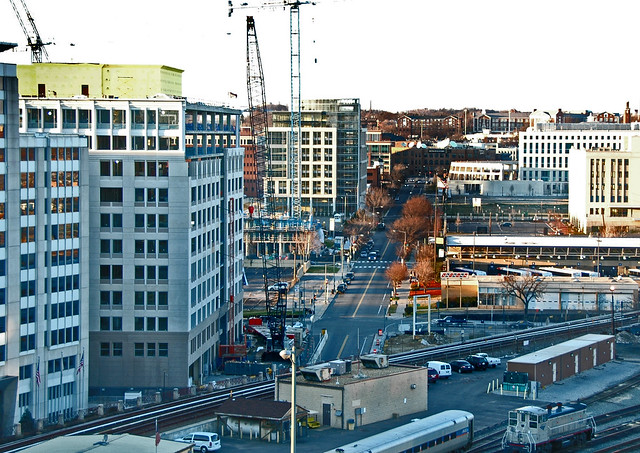
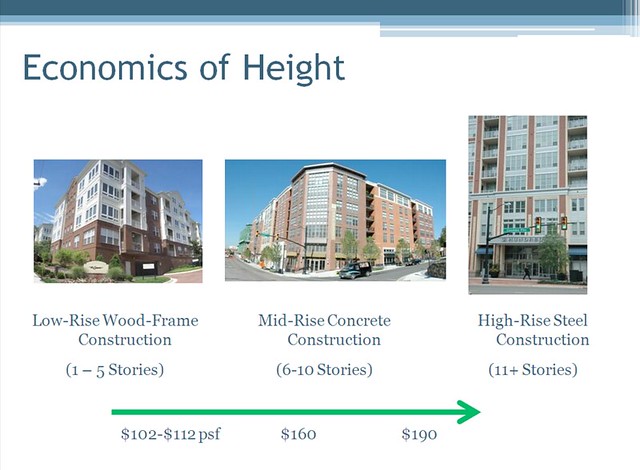
Toronto is also exemplary in its embrace of mid-rise development along mostly auto-oriented strips — reinventing the highway strip into streetcar/BRT strips — but the implementation so far has been subpar.

Lively, affordable strip malls full of independent shops are being replaced by dull condo buildings with chain stores, because the new condo retail is too expensive and often too spacious for independents, and condo boards resist all but the safest tenants… Transit is tangled in politics and not getting built. The new buildings still feel isolated rather than part of a continuing streetscape.

2. Over in the more highfalutin’ Harvard Design Review, Alex Krieger asks a similar question:

One set of ideas about good urbanism may not be sufficient. We know from experience, and from the many prefixes that we attach to the word, that across an urban region there are multiple urbanisms, hardly all conjuring up the same well-scaled, well-defined finite “urb” guarding its enduring spatial character…

What is more interesting, and found in many mature areas of urbanization, is the juxtaposition of different patterns of settlement in close proximity. Competing urbanisms may actually be a good thing for an urban region…

My intent in applauding a range of urban environments found in a metro region is to question the ferocity behind the ideological battles under way among today’s various guardians of a particular urbanism. Isn’t a proliferation of ideas about urbanization a good thing? [….]

Conversely, and equally disrespectfully, many dismiss New Urbanism as if its proponents offer no insights about cities. This too is foolish. The New Urbanism movement has raised public awareness about the social and environmental limitations of extensive suburbanization; convinced many subdivision developers to think differently about their generic layouts; pointed to outdated zoning codes that privilege single-use districts; altered the Department of Housing and Urban Development’s view on what public housing should look like and how it should be best arranged; and highlighted the “un-usefulness” of the engineering profession’s concern for optimizing the movement of cars above all. These are not inconsequential achievements for a movement that progressive architects dismiss for the sin of promoting traditional architectural imagery. Newly minted Landscape Urbanists can also be dismissive when implying that those who wish to learn from traditional urban patterns are simply Luddites…

Jacobs explains, cities are environments of not one but multiple complex problems. While not always apparent, each aspect of urban complexity is somehow interconnected to others. Planning for human settlement, therefore, requires the seeking out of both direct and subtle interdependencies prior to posing conclusions or plans… Perhaps too few of us get to page 448 in Death and Life. If we side with Jacobs (and who claims not to), then we need today’s urban polemicists to continue to offer their insight, if fewer of their universal truths — to keep jousting intellectually and, more important, to endeavor to seek out the interdependencies among their positions.

Going forward, let’s all strive to understand the multiple complexities that comprise our cities.

Central DC: home to both bikes & young adults

Two recent geographic visualizations that describe my little corner of the District (and world):

First, MIT’s Media Lab, via their YouAreHere site, generated this map of the fastest mode of transport from my neighborhood to the rest of the city:

youarehere: SW Waterfront

Indeed, this more or less describes my travel decisions: I’ll bike anywhere in the L’Enfant City (where most attractions are) or along the rivers, take transit if going along the Green Line or to Silver Spring, and don’t really bother with the edges of town (including Upper NW).

The highest “percent of the city that can be reached fastest” by bike that I found was 62.7% of the city, from Stanton Park — but for most of the L’Enfant City and Mid-City, bicycling is the fastest way to get to about half the city. For transit, it’s 27.6% from Metro Center. Yet from most of the edges of the city (whether Ward 2, 3, or 8), cars are sadly still too convenient; 80%+ of the city is most quickly reached by driving.

A sad testament to the relative lack of speed of transit in Chicago: even from downtown, only 2% of the city is most quickly reached by transit.

Second, there’s this interesting “cross-section” visualization from Luke Juday at UVa’s Demographics Research Group, which underlines the increasing self-segregation of young people within the urban core:

No, the percentage of 20-somethings in the urban core didn’t appreciably increase. However, since the region’s population is now older, the core’s percentage went from 50% higher than the metro average to 100% higher, as 20-somethings have deserted the suburbs and piled into the urban core. The only area that gained 20-somethings is the near east side of town, which is a theme that the post’s other graphs explore.

And yes, the latter phenomenon just might have something to do with the transportation characteristics outlined in the former.

Industrial change created a peaking problem for Chicago transit

[An entire month without blogging — let’s fix that. This post started with a Twitter conversation about the unusually low peaks in how Montreal schedules its Metro trains, perhaps because it’s not as 9-5 as other cities. A note about the charts: it turns out that I can’t embed Datawrapper charts on WordPress.com, so the ones below are screen caps. Just click on the chart to go the original chart and see the source data.]

Along the lines of “the best transportation plan is a land use plan,” sometimes land use changes can impose huge costs upon the transportation system. As an example, let’s examine how industrial change in central Chicago triggered vast, and costly, shifts in how the CTA arranges its services.

Chicago skyline in 1970

Chicago

Chicago skyline in 2010 (slightly narrower view)

Popular perception understandably saw downtown Chicago as a boomtown: Enough skyscrapers were built to house all of downtown Philadelphia’s offices, plus all of Glenview or Moline’s residents. Within the high-rises, private-sector office jobs (in business services and finance) grew by 53%. Yet the total number of jobs in Chicago’s Central Area (source) grew surprisingly little in the 1980s and 1990s — by just 10.4%.

The growing skyline masked a sharp decline in nearby industrial jobs. Together, the manufacturing, transportation/utilities, and wholesale sectors lost 42% of their center-city workforce. This bifurcating job market, common to many deindustrializing American cities but occurring on an leviathan scale in Chicago, exacerbated the city’s social divides, plunging some neighborhoods into despair and richly rewarding areas just blocks away.

In short, employers stopped bringing three shifts of workers every day to handle machinery (physical capital), and started bringing one shift of workers every day to interact with one another (human capital). Even if the number of jobs remained the same, the amount of travel capacity needed would triple.

This tremendous economic shift remade the paths of Chicagoans’ daily travel, and to a large extent demanded a reconstruction of the city’s transit system. Despite the Loop’s triumphant skyline, everyday Chicago was for many years a collection of factory towns stitched together along streetcar seams. The factories lined up along the various rail or river routes leading into the city, and the high-level services they required were provided downtown, but their workers came from all over. Terry Clark writes in the essay “The New Chicago School”: “immigrants naturally lived in neighborhoods where they could talk, eat, relax, and worship with persons of similar national background. They would commute even to distant factory jobs to preserve this neighborhood-cultural-ethnic heritage.”

Much of the city’s employment was at three-shift, all-day factories, where workers had to be present all day – because inputs (like shipments of livestock) arrived at all hours, because steam-era machinery can’t just shut off (e.g., a blast furnace can take over a week just to fire up), or because the machinery was expensive relative to the labor and had to be amortized by constant use. As a result, work trips and service levels were remarkably consistent throughout the city and the day; that combined with the city’s grid to create the gridded bus network we all know well. The comprehensive transit system even worked overnight: The 1957 route map lists 69 surface routes and nine elevated lines running all night. Yes, the “L” system did its work of shoveling people into the congested Loop, but even there it only carried 25% of all transit passengers — even to downtown, 75% arrived via the surface lines.

Just like manufacturing, transit is also a capital-intensive enterprise, and having steady ridership all day/all night makes sure that the equipment (and labor) is optimally used. There’s no need to buy streetcars and pay drivers just to shuttle one giant crowd in at 8 AM — and then keep the fleet parked until they leave at 5 PM. Also, it’s all-day transit, not peak service, that enables urban life: as Jarrett Walker writes, “Low-car or no-car lifestyles, in turn, mean that transit has to be available for many of life’s purposes, not just the peak commute.”

The deep spiral of deindustrialization that I mentioned above also changed where and how Chicagoans commuted. Instead of dispersing themselves across the city at all hours of the day — a flow that became better suited to driving anyways — people began piling onto Loop-bound trains for 9-to-5.

Commuter trains always ran highly “peaked” service, with many more vehicles during rush hour, but these services’ peaks have dramatically grown. The commuter line from Hyde Park to the Loop used to run a 2:1 ratio of peak : midday trains in 1939; now that’s a 7:1 ratio.

Bus ridership, particularly crosstown, dropped off — setting off a vicious cycle of cuts (chronicled by Joshua Mason and Graham Garfield) that reduced crosstown bus service to a shadow of the former streetcar empire. Today’s route map counts a mere 17 all-night surface routes; three-fourths of the corridors that used to have nighttime transit now don’t.

Yet parking buses overnight is relatively easy to do, even though idle capacity is expensive in the long run. What’s been much more difficult, and costly, is adding new capacity to accommodate the ever-larger rush hour crowds, particularly for the growing (Loop-centric) rail system and commuter express buses. Already, CTA spent $530 million on the Brown Line Capacity Expansion Project, which increased train lengths by one-third, and more recently spent over $1 billion on a train order that increased its fleet by 17%. Many of its other planned capital projects, like rebuilding the North Side Main and untangling Clark Junction, will also sink huge sums into upgrading the system to accommodate rush hour crowds.

A small countervailing trend has more recently emerged, though. The city as an entertainment destination — as a site of 24-hour consumption, rather than production — has pushed the system to slightly extend evening hours. That said, the efforts will always pale in comparison to the overnight network that once existed, serving not the few who partied all night, but rather the many who worked all night.

Why NoMa, not your neighborhood, got $50 million for parks

Looking north on 1st St NE

As with other new parks in general, there seems to be a lot of confusion out there about the $50 million that was recently allocated within DC’s capital budget for parks in NoMa.

First, it’s conventional wisdom at this point that upzoning NoMa without requiring any dedications of open space was “flawed.” That said, it probably seemed like a reasonable decision at the time. Nobody expected the area to develop quite as quickly as it did, or with as many residents as it did. (Office workers only require residual park space.) Besides, DC was land rich and cash poor, and thus didn’t have the capital to purchase even what seems now to be relatively cheap land; now, we’re relatively cash rich and land poor. Regret’s easy in hindsight.

Now, where did this $50 million come from? Yes, it’s now been set aside in DC’s capital plan, to be paid out over several years, and those capital funds come from general taxation. But, in another sense, it’s a thank-you to NoMa for the plentiful — and lucrative — new development that it’s brought to the District.

Way back in 2011, the NoMa BID and city councilmembers proposed a tax increment financing (TIF) district for NoMa. The TIF would have captured $50 million from the property taxes that NoMa properties paid, diverting it from the general fund to a BID-administered fund to pay for local parks. That’s a lot of money, sure, but consider that, by 2012, NoMa was paying $49 million each year in additional property taxes (over 2006 levels). Under a TIF, only NoMa taxes would pay for NoMa parks — although it’s true that government spending is theoretically fungible.

DC’s CFO had concerns about the TIF, which they outlined in this testimony to the Council. Their two key complaints centered on accountability of the BID-administered funds, and an odd feature of DC’s governance: its self-imposed debt cap. By diverting general property tax revenues, the CFO argued, the proposed TIF could jeopardize the way DC’s debt-to-income ratio is calculated, and push the District past that magic (and, again, self-imposed) line.

(Note that by borrowing from future tax revenues, a TIF is a nifty way to solve that “land rich, cash poor” conundrum I mentioned above. DC doesn’t have very many TIFs, compared to other cities.)

With that in mind, the Council declined to pass the proposed NoMa TIF legislation, and the NoMa BID instead pushed to include the parks within the city’s general capital budget. Mayor Gray did exactly that in 2013, adding the $50 million to his FY 2014 budget. Subsequently, the Council adopted the 2014 budget.

So, yes, NoMa did get $50 million in tax revenue to pay for parks. However, it did so by paying the city far more than that in advance, and by threatening to withhold future tax revenues. Until your neighborhood can raise similar funds from its own development projects — as the Yards and the Wharf have done, for example, or as Georgetown Waterfront did from the neighborhood’s deep pockets — you can’t necessarily expect the same outcome for your neighborhood.

One more note about local parks: it appears that NPS (which isn’t funded through local value capture) is aware of local trails’ safety shortcomings, including the “Peter’s Point” junction I’ve previously complained about.

It’s not just a phase: urban population dynamics have changed

National Park Seminary new EYA townhouses

EYA townhouses in Forest Glen, Md.

Ben Adler from Grist wrote about a recent NYT trend piece about how suburbia is hollowing out, with few young families to replace the empty nesters. He puts too much emphasis on gross migration and population change, without drilling into how those components have been changing:

A handful of coastal and upper Midwestern cities are attracting more young professionals than before and are retaining them for longer… Even where gentrifiers are moving in at a pace sufficient to reverse outmigration, they’re barely making in a dent in reversing the tide.

Migration population losses from cities paint an unnecessarily dire view of urban prospects. There is a good reason why large metros would tend to lose people to domestic migration — and, for the 20th century, pretty much always did. A statistically significant group of young people move to large cities, get married there, have kids, and then move away in search of more appropriate housing. Two people move in, three move out: presto, population “loss,” even though the same number of people moved in and out. Similarly, for decades a steady flow of retirees southward, away from large cities, was a good thing for society — an indicator that healthier seniors were physically able to move, rather than remaining house-bound.

Yet long-established movements like these (plus shrinking household sizes, plunging overcrowding, the twin crises of deindustrialization and crime, and employment displacing relatively dense central-city residential), may have largely run their course.

Yes, this does indicate that “the school problem” remains,* but indications are that cities are attracting more young people, and retaining them for more years. This is occurring both before and after the critical life milestone of marriage: new households are overwhelmingly singles, couples, and unrelated persons. Whereas many of the 1950s pioneers who settled what are now inner-ring suburbs were young families headed by 20-somethings, or maybe 30-somethings, today many married couples (without kids, or with young children) stay in the city for longer.

Here in DC (where the city’s small size and overwhelmingly post-industrial nature makes the demographic transition especially sharp), Carol Morello from the Post observes:

the number of children younger than 5 has grown by almost 20 percent, from 33,000 to 39,000, according to census figures. In the same time span, the number of children ages 5 to 13 rose 7 percent. But there were fewer children 14 and older, suggesting that many parents still choose to leave the city when their children reach high school.

This also shows up anecdotally, as in the NYT’s quote of a Westchester County official (“Parents used to be 35ish, now they’re 45ish. What we’re seeing is not so much an exodus as a later arrival”) and this observation (at a recent ULI conference) by the biggest developer of townhouses inside the Beltway:

Within the DC region, the geographically compact core (about 3% of the region’s area) accounts for a huge share of net growth of 25-34s. (Drawn from 2010-2012 ACS.)

A larger share of households spending more years living in the city is a marginal boon to cities’ residential market share. Few Americans live in one place for life, anyways, but imagine the implication for apartment owners as their tenant pool both grows in size and stays longer.

Meanwhile, population decline hasn’t hurt some urban areas (like my old neighborhood of Bucktown, where densities on some blocks have fallen 90% since their WW1 peaks, and continued falling in recent years). These can feel more lively and active than ever, even with much-reduced populations, because incomes are way up. More disposable income can substitute for a smaller population; retailers look for underserved pockets of spending power, not necessarily people.

Yes, at the end of the day, cities need to provide homes for a growing global population and so should welcome growing populations. However, gross population shifts need to be disaggregated and viewed cautiously.

On another note entirely, I’d like to honor the recent passing of Donald Bogue, 1918-2014, who taught me much of what I know about demographic processes. (My “Relocated Yankees” paper was done as a final project for his class.) Even though he was well into his eighties when I took his class, his approach was the best of UChicago: thoughtful, broadly read, engaging, and kindly critical, and he helped to tie together a lot of loose ends that I’d thought about for many years. He leaves behind a tremendous published legacy — scores of publications in the Library of Congress, for instance — and his work on topics like Skid Row still has strong resonance in planning today, for example in understanding the historical intersections between homelessness and place.

* Don’t look at me for any answers; this isn’t a school policy blog.

Lumpiness: in cities’ property values, and in metro structure

Two only tangentially related thoughts on lumpy growth:

1. Richard Florida in The Atlantic Cities was one of the few major outlets to cover a report from the Demand Institute (a collaboration between Nielsen and The Conference Board) called “A Tale of 2000 Cities.”

The top 10% of American cities account for more housing wealth than the next 90%. The gains in the 2000s were tilted towards the already wealthiest communities.

The report includes an extensive look at a typology identifying nine types of American communities primarily by the strength of their local housing markets, post-recession. In keeping with the name, the results show a striking divergence, with a select handful of healthy markets sweeping up much of the gains — and leaving half of American cities and towns “currently facing fundamental economic pressure.” The report’s summary says: “In today’s global economy, nothing is more important than the strength and sustainability of the local labor market, regardless of whether employers are serving customers in Chicago, Chile, or China.”

If anything, today’s telecom-centric, information economy has resulted in the geography of opportunity getting lumpier, not more diffuse (a prediction going back to Toffler’s “electronic cottages” in 1980) — “reports of the ‘death of distance’ have been much exaggerated.” We telecommuters haven’t all decamped to mountaintops. The most valuable places are becoming even more so: they account for not only an outsized share of wealth but also the gains of recent years.

The underlying economic reality, that human capital is what drives most prosperity today, is why I differ from my colleagues who believe that “investment ready places” can thrive based on previous investments in capital goods like housing. Jane Jacobs agrees: “Many attractive looking little cities stagnate or dwindle; Scranton, where I grew up, is an instance. The determining factors, rather, are economic opportunities.”

(I’ll have more thoughts in a later post about how macroeconomic changes, and in particular greater economic inequality, have left their mark on “gateway cities.” In the meantime, I highly recommend Ryan Avent’s ‘The Spectre Haunting San Francisco,’ which ties in man-of-the-moment Thomas Piketty as well.)

(April 2018 update: Florida points to a 2016 paper by Albouy and Zabek showing that housing value inequality, which was suppressed from 1940 to 1980, is back at levels last seen in 1990 and 1930. Furthermore, this increase is primarily due to inequality within metro areas [e.g., run-ups in favored-quarter prices], which has increased fairly steadily since 1970, rather than between metros.)

On another note, the report also has a good omen for suburban retrofits in “favored quarter” suburbs, in the form of an interesting but familiar disconnect between housing supply and demand in “Affluent Metroburbs.” 58% of housing stock in these communities is detached, “but fewer than half [of those seeking to move] say they are seeking a detached single-family home, compared with a national average of 60 percent.”

Among residents of “historic skyline cities,” a broad category that includes both healthy and less-healthy cities, there isn’t exactly a stampede to the exits. 54% of those who intend to move still “intend to stay in an urban area,” and “nearly one in five” wants to move for better schools (hardly the unanimity some cry about).

2. Alon Levy has a great post about how, on a macro scale, the gridded West has a suburban layout that fosters high-coverage bus networks, whereas more organically settled Eastern suburbs have a dendritic, hub-and-spoke layout that lends itself to commuter rail. (Yes, he points out that Johnny-come-lately Washington has, through Metro, grown into the latter pattern.)

This might go some way towards explaining “the Western Paradox” in Brookings’ findings regarding transit access to jobs. In short, Western cities (particularly in the desert southwest) had a strange spread: many jobs were technically accessible by transit, but low transit-to-work mode shares. The highest mode shares were found in older eastern cities, where a large fraction of suburban service jobs are inaccessible by transit.

A rising Potomac: oh, dam it

30m sea level rise along the Potomac

30 meters of sea level rise would wipe out most of the L’Enfant City, put the White House underwater, and leave the Capitol on a little island — but it could still be managed by damming the Potomac River at key locations, like Quantico or Mason Neck.

Of the world’s major coastal-plain cities, Washington, Rio, and London are among the few that could conceivably be saved by damming estuaries, although I’m sure the Japanese will still try. (Or maybe Houston.)

The same can’t be said for Philadelphia, where the Delaware has a very broad valley, or even New York, where dams at Verrazano Narrows and Arthur Kill will have to be supplemented by very extensive construction to block Long Island Sound. Boston either becomes an archipelago or a polder at a mere 7m of SLR. Even Montreal faces serious property loss over 20m; at 30m Beijing becomes coastal and tides could reach Lake Champlain and the Caspian sea.

Much more than 30m, like the 60m these guys have in mind, and most everything on the east coast below the fall line would be gone. Even dams at the Golden Gate and St. John’s would no longer protect San Francisco or Portland. That’s when inland real estate might become rather more valuable.

Surprisingly, my river-view apartment should be okay up to +10m or so even without a downstream barrier.

Generated using flood.firetree.net/

[Posted to Flickr on 12 June 2012, but today’s Antarctic ice sheet news reminded me that I never cross-posted it here.]

Telematics can reinforce centralization

Self-valeting vehicles would make going downtown a lot cheaper and easier. Photo: Steven Vance

1. Telecommuting is great, but only to a point. According to Gallup, “the ability to work remotely corresponds with higher engagement, but primarily among those who spend less than 20% of their total working time doing so.” Employees who spent more than 50% of their time working remotely had engagement and disengagement figures similar to those who never worked remotely. (The release also has some nice quotes from Vint Cerf at Google about the value of face-to-face interaction, and how they’ve sought to increase collaboration within the workplace.)

2. On a similar note about the potential of telematics, there’s a lot of hype out there about autonomous vehicles, aka driverless cars, but Nat Bottigheimer and my former colleague Brooks Rainwater have appropriately measured responses.

In the few conversations I’ve had with transportation professionals about their impact, their understanding is similarly muted. Yes, platoons of autonomous vehicles will squeeze a little bit more capacity out of existing roads while maintaining laminar flow, but it’s not as if there’s scads of peak-hour capacity remaining to be had.

The really big impact will be upon parking. By removing the cost and hassle of parking at the final destination could make urban centers even more valuable, and further diminish the primary appeal of drivable (really, parkable) suburbia — which is that it’s easy to drive to, and park at. If both of those factors become immaterial, then why bother driving to the B-mall when you could go straight to the A-mall, or downtown?

Similarly, an interesting class divide could arise if the vehicles really do succeed in eliminating driver-error crashes. Such crashes could soon become stigmatized as something that only happens to poor people who can’t afford fancy crash-avoidance technology. (Do people today cluck-cluck with resignation about people maimed in car crashes because the inexpensive cars said victims bought used were not equipped with adequate airbags?)

Shorts: parking craters, carbon tax, Census tools

toys

Urban renewal in New Haven created a “towers in a parking lot” environment, replacing its lower-scale past.

Several springtime shorts:

1. My Streetsblog post about Chris McCahill’s parking research got a strong reception last week:

Streetsblog recently spoke with Chris McCahill of the State Smart Transportation Initiative in Madison, Wisconsin, to learn about his research into how parking affects small cities’ downtowns. Most recently, McCahill and his co-authors have shown how policy makers’ preoccupation with parking not only hollows out city centers, it also decimates the downtown tax base.

2. In carbon tax news, DC residents Christine Lagarde and Jim Yong Kim (who might know a bit about economics and taxation) both endorsed a carbon tax shift at last week’s IMF/World Bank Spring Meetings, per a report from the Sydney Morning Herald. Meanwhile, revenue-positive carbon tax legislation was introduced in California.

3. Three neat online Census tools for future reference:
Demographics around a point, from Census 2010 (so, alas, limited to the short form, but useful for gross population)
Shift-share analysis, to see how your area’s job creation in various sectors leads/lags its peers
Economic development cluster mapping, identifying geographic concentrations of firms by NAICS code and county

Modernist town founder urges evolution, not stasis, for his jewel

Reston: Lake Anne Village
[Nobody’s around to sit with Bob by the shores of Reston’s Lake Anne.]

One new fad insists that Modernist urban plans were designed as totalizing works of art, and thus should be frozen in their as-built, “apex” condition. That’s even though such places often were never built to their originally planned capacity, and almost always fail to draw the crowds that were promised. However, most of the auteurs who dreamt up and built these places have passed on, and we thus have no way to ask them whether their plans were truly end-state designs, or whether they were starting points for natural urban evolution — whether the founders hold more sacred either the intent, or the letter, of their plans.

Tom Jackman from the Post gets a word in with Robert E. Simon, one of the few long-lived Modernist visionaries who still plays an active role in his built creation:

Redevelopment is also in the works for Reston’s original centerpiece [link], the Lake Anne Village Center, including the addition of 800 residential units nearby. That, Simon said, ‘is an answer to a prayer’ because more than anything else, he still wants Reston to one day be a true walkable community… Of the seven village centers that Simon envisioned as creating a sense of community, only Lake Anne resembled that vision of shops, businesses and housing in one place. His hopes for multiple high-rises never materialized, so Lake Anne’s retail shops gradually fell into decline or closed… Simon remains convinced that village centers can create the community that makes Reston distinctive and is thrilled that a developer plans to remake Lake Anne Village Center, where Simon lives. The plan will replace an 180-unit apartment complex with 1,000 townhouse and apartment units, a concept on which Simon was consulted.

Planning’s fruits include Shaw’s Progress(ion Place)

Progression Place

Eight years on, the District seems to have gotten a nice return on its $20 million investment into Progression Place, the long-awaited development that replaced a city-owned parcel above the Shaw Metro that some called “the block of blight.” Not only has the Mid-City neighborhood gained an employment anchor (DC’s grants went to the office portion) and 50 units of affordable housing, but Progression Place also created a lively block of walkable retail that complements DC’s adjacent investments in the Metro and the Howard Theater. So yes, although you may have to wait a while, sometimes city plans do eventually work according to plan.

From a planning perspective, Progression Place features a broad mix of uses at a fairly high intensity:

  • It anchors a new uptown office district, with 100,000 sq. ft. of new offices being built now for the UNCF and Teach for America. Next door, the Wonder Bread factory has another 98,000 feet, for a combined daytime population at lease-up exceeding 1,000. It’ll be interesting to see who moves in here; even beyond the Digital DC initiative focused here, TFA is known as having a younger constituency than most other federal programs. Although the Green Line has spurred great residential and retail growth, its potential for office is rather less tested.
  • 205 apartments; 1/4 inclusionary, with both low and moderate income price points.
  • The retail tenant mix has a few nationals (Bank of America and Sprint) alongside several established local operators, led off with a critical mass of food & beverage destinations. The merchandising by StreetSense is also first-rate, and not only because I’ve a known soft spot for beer, bakeries, and tea. Having great retail in place (and thus a high Walk Score) will help residential leasing. I suspect that retail is somewhat of a loss leader here, which might explain why the retail and residential are under one owner.
  • There’s underground parking, but the overall parking ratio is about 0.57 spaces per 1,000 sq. ft., shared with the historic Howard Theater next door. A comparable project in the suburbs might include 4-5 times as much parking.

Just as importantly, the building’s architecture pulls off the “vanishing high-rise” trick quite well by setting the tower 35′ behind the storefronts. What could be an overwhelming slab of an apartment building — with a net density of 301 dwelling units per acre, excluding the site’s office and T Street wings — disappears at street level behind the historic row of storefronts:

Progression Place Storefronts

The 19,500 sq. ft. of retail is almost entirely housed behind retained and rehabilitated historic storefronts, retaining not only their appearance but also the fine-grained scale — i.e., the neighborhood’s classic rhythm of narrow lots and small bays. The original finishes, like exposed brick, carry through to the interior — but behind the front room, modern new building services are provided in the back of the house, as part of the new structure. This transition (visible in the retail floor plan) is subtle enough to have evaded notice by at least one table of architects I was dining with.

In some respects, this project probably benefitted from having local firms in charge of development and leasing, including layering a complex capital stack, and then selling the property on to a national income-oriented owner. Four Points’ next project might well be downtown Anacostia, a site they’ve been waiting on for several years.

Disclosure: I have no financial interest in any businesses or properties named, or located on named sites.

[Blogging update: now that I’m working at Streetsblog, I might be able to repost some pieces from there, and will continue reposting items cross-posted to Greater Greater Washington or written for other venues.]

Between rocks and a tall place: two height limits hold back affordable mid-rise construction in DC

economics of height

In the fable of the Three Little Pigs, one pig builds a house from straw, a second from sticks, and a third from bricks, with very different consequences. Notably absent from the pigs’ tale is any mention of each little pigs’ construction budgets. For humans living in the 21st century, it’s not protection from hyperventilating wolves, but rather out-of-control budgets, that determine our choices of building materials.

The Height Act limit for construction in outlying parts of Washington, DC, enacted back in 1899, is 90′ — effectively 7-8 stories. This particular height poses a particularly vexing cost conundrum for developers seeking to build workforce housing in DC’s neighborhoods, since it’s just beyond one of the key cost thresholds in development: that between buildings supported with light frames vs. heavy frames. Heavy frames rely on fewer but stronger steel or reinforced concrete columns to hold up the building, and are better known as Type I fireproof structures. Light frames rely on many small columns (usually known as studs), and are usually referred to as Type II (if masonry or metal) or if wood, Type III (with fire resistive treatments), Type IV (if made from heavy beams), or Type V (if little fire-proofing has been applied) construction.

Future 10th Street Cutting Through CityCenterDC
[Type I: CityCenterDC, photo by David Gaines/Flickr]

Takoma Station
[Type III: Takoma Station, photo by author]

stick over concrete platform
[Type III: stick over concrete podium on 9th St. NW, photo by author]

These structural types are rated using the degree of fire protection that these structures offer, with lower numbers denoting more fire-resistant structures. In DC, they’re defined in the city’s building code, which is based on an international standard — the International Code Council (ICC) and its “I-Codes.”

The ICC’s Table 503 sets limits on how high different types of buildings can be. Thanks to technological improvements to wood and fire safety improvements to buildings, mid-rise buildings can be built up to five floors high using Type III construction. These five floors can, in turn, be placed atop a one-story concrete podium to build a six-story mixed-use building.

How much cheaper?

Light frame construction cuts costs in two principal ways. Light frames use fewer materials in the first place and thus have smaller ecological footprints, particularly since cement manufacturing is one of the most carbon-intensive industries. Light frames are built from standardized parts that are usually finished off-site, rather than on-site, so materials are cheaper, on-site storage and staging (e.g., cement mixers) require less space, and construction is faster — further reducing overall construction costs, since developers pay steep interest rates on construction loans.

These cost savings really add up throughout the entire building. The ICC’s Building Value Data provides national average per-square-foot construction costs for multifamily of:

$104.74 Type V Low-rise wood frame
$119.77 Type III Mid-rise wood frame, fire-resistant walls
$139.01 Type II Mid-rise, light-gauge steel
$150.25 Type I High-rise fireproof

Similarly, the RS Means construction cost-estimator database provides 2012 estimates (adjusted for local prices in DC) that show an even steeper premium for high-rise construction:

$136.70 Type V Low-rise wood frame, 3 stories
$162.87 Type II Mid-rise, light-gauge steel & block, 6 stories
$246.32 Type I High-rise fireproof, 15 stories

As the ICC figures show, switching from Type III to Type I construction increases the cost of every square foot by 25.4%. Thus going from, say, a six-story building to seven stories only increases the available square footage by 16.7%, but increases construction costs by 46.3%. This results in a difficult choice: go higher for more square feet but at a higher price point, or take the opportunity cost, go lower, and get a cheaper, faster building?

In most other cities, the obvious solution is to go ever higher. Once a building crosses into high-rise construction, the sky’s ostensibly the limit. In theory, density can be increased until the additional space brings in enough revenue to more than offset the higher costs. As Linsey Isaacs writes in Multifamily Executive: “Let’s say you have a property on an urban infill site that costs $100 per square foot of land. Wood may cost 10 percent less than its counterpart materials, but by doing a high-rise on the site, you get double the density and the land cost is cut in half.”

Yet here in DC, the 90′ height limit on residential areas, and commercial streets outside the core, tightly caps the additional building area that could pay for high-rise’s substantial cost premium.

Within the twilight zone

For many areas in DC, land is expensive enough to fall into a Twilight Zone. These areas are both expensive enough to require high-rise densities, but the local rents are too cheap to justify high rises’ high per-foot construction prices. These areas are not super-trendy like 1st St. NE in NoMa or 14th St. NW in Logan Circle, which are seeing an explosion of Type I construction (and prices to match, with new apartment buildings selling for $900/sq. ft.). Nor are they outlying areas, where developers think the opportunity cost of forgoing a future high-rise is acceptable and thus proceed with Type III construction. The recent apartment boom has given local residents a good, long look at Type III construction: in outlying city neighborhoods like Brookland, Fort Totten, Eckington, Petworth, off Bladensburg Road, and in suburban areas like Merrifield and White Flint.

In areas that are in-between, a lot of landowners are biding their time, waiting until the moment when land prices will justify a 90′ high-rise — a situation which explains many of the vacant lots in what might seem like prime locations. My own neighborhood of Southwest Waterfront is just one example. Within one block of the Metro station are nine vacant lots, all entitled for high-rise buildings — but their developers are waiting until the land prices jump high enough to make high-rises worthwhile amidst a neighborhood known for its relatively affordable prices. While the developers wait, the heart of the neighborhood suffers from a critical mass of customers within walking distance; the resulting middling retail selection, vacant storefronts, and subpar bus service reinforces the perception that Southwest Waterfront is not worthy of investment. Nearby Nationals Park is similarly surrounded by vacant lots, with renderings of nine-story Type I buildings blowing in the breeze.

In NoMa (east of the tracks) and the western end of H St. NE, projects like 360 H and AVA H Street were redesigned after 2008’s market crash so that they didn’t require Type I construction. The redesigns reduced costs, reduced the developers’ need for scarce financing, and made the projects possible — but also reduced the number of units built. AVA was entitled for almost 170 units, but was built as 138 units: building 20% fewer units cut structural costs by over 40%, according to developer AvalonBay.

Elsewhere, some other development projects have similarly been redesigned with faster Type III construction, even as future phases assume Type I construction. Capitol Quarter, the redevelopment of Capper/Carrollsburg near Navy Yard, might win an award for the shortest time between announcement and groundbreaking for the mixed-income Lofts at Capitol Quarter. Several blocks west, the first phase to deliver at the Wharf will be the last phase that was designed; in fact, the idea of redeveloping St. Augustine’s Church as a new church with a Type III residential building above came years after design began on the high-rises to its west. Rumor has it that across the street, a developer is redesigning an 11-story high-rise as a Type III building, foregoing five floors of housing in order to get to market faster.

New technologies can break the logjam

If it weren’t for the Height Act, developers wouldn’t just sit and wait on sites like these. They’d probably just build Type III buildings, and if there’s still demand, they could build Type I downtown towers with 20+ floors. But due to the Height Act, DC is one of the only cities in America where there’s a substantial market for 7-8 story buildings.

To break this logjam without changing the Height Act, DC’s building community can embrace new light-frame construction techniques that can cost-effectively build mid-rise buildings without the need for steel beams and reinforced concrete. Local architects, developers, and public officials could convene a working group to bring some of these innovations to market, and thus safely deliver more housing at less cost.

Cross laminated timber (CLT), a “mega-plywood” made of lumber boards laminated together, has sufficient strength and fire resistance for high-rise structures; it’s been used to build a 95′ residential building in London and a 105.5′ building in Melbourne. The ICC has approved CLT for inclusion in its 2015 code update — but the city has leeway to approve such structures today under a provision that allows “alternate materials and methods,” and cities like Seattle have started to evaluate whether to specifically permit taller CLT buildings.

Construct-ivism
[The Bullitt Center, a zero-impact building in Seattle, uses CLT for most of its upper-story structure.)

Type II buildings, often built with light frames of cold formed (aka light gauge) steel, can achieve high-rise heights but are limited by the ICC to the same heights as Type III. (For example, 360 H Street was re-engineered from Type I to Type II, and lost two stories in the process.) Prefabrication, hybrid systems that incorporate other materials, and new fasteners have made mid-rise Type II buildings stronger and most cost-effective. However, as the RS Means chart above shows, Type II might be cheaper than Type I but remains more expensive than Type I. Similar prefabrication has been applied to Type I mid-rises on the West Coast to reduce their costs.

By embracing these advancements in structural engineering, as well as providing relief from onerous parking requirements, DC could more easily and affordably build the mid-rise buildings that will house much of the city in the future.

(Thanks to Brian O’Looney, partner at Torti Gallas and Partners, for sharing his expertise. A version of this post was cross-posted at Greater Greater Washington.)