Some guesses as to implications of autonomous vehicles

Autonomous vehicles, driverless cars: ask two people what they think, and it seems like you’ll get three opinions. Here are my reactions to four recent publications on the topic — keeping in mind that previous reports of distance’s death were an exaggeration. (As CBRE’s Revathi Greenwood notes, vehicle speeds won’t change, and so Marchetti’s Wall still remains. Even if the drudgework of driving is taken away, travel time still has a cost, and we’d rather be at our destinations already — e.g., “are we there yet?”)

WSJ (columnist Christopher Mims):

  • AVs will be limited to small areas for the foreseeable future. “We’re likely to see vehicles that don’t require drivers but can only operate on a fixed, well-mapped route in cities with fair weather… the consensus of those I interviewed is that it will be many years before we get cars that can truly go anywhere.”
  • Existing trials (Singapore, Pittsburgh, Babcock Ranch), which are limited to relatively small, intensively researched areas that are frequently remapped. Level 2/3 autonomy will remain limited to expressways, which have a protected ROW.
  • Echoes some of Recode’s timeline (perhaps similar sources were interviewed).
  • Takeaway: Autonomous shuttles will appear within campuses, urban districts, and planned communities, initially as “walk extenders.” “Robot valets” will enable more remote parking and reduced parking footprints. Freeway driving may shift to autonomy, but uptake is limited by consumer acceptance (see next).

Kelley Blue Book consumer survey:

  • Americans are still broadly uncomfortable with the idea of Level 5 autonomy.
  • Level 4 autonomy is most popular with current US consumers, who still want to be able to take the wheel. Level 3 seems less comfortable than Level 2.
  • However, key early-adopter groups feel more comfortable with complete autonomy: luxury car buyers, consumers with experience with Level 2 AVs, and people used to the backseat: ride-hailing customers and teenagers.
  • Takeaway: The transition to AVs is dependent upon social acceptance, and currently many Americans want to maintain the status quo. The transition might take a while (more Americans will have to try AVs), but may be steep once it happens.

Rocky Mountain Institute forecast:

  • Mobility services in major US metros are a potential $120 billion annual market by 2025, including $60 billion just in large Sunbelt metros.
  • Because AV and EV technologies reduce operating costs and increase capital costs, they will find broad acceptance in high-utilization fleets first, where their low costs will subvert the individual-car-ownership paradigm. (2017’s EVs will be cheaper for fleets than gas cars.)
  • AVs will cut the cost of rides by 60% to be cost-competitive with car ownership by 2018, with another 60% decline in costs as economies of scale are realized. The switch from personal cars to AV fleets will occur between 2020-2025, with long-term demand for cars falling to ~6 million.
  • Lower mobility costs will result in a $1 trillion annual consumer surplus to be spent on other sectors. (Keep in mind that spending on autos has a low multiplier effect.)
  • Even if VMT doubles and more power plants are built, these two technologies will result in sharply lower CO2 emissions (nearly -1 GT CO2E by 2040 = ~13% cut in today’s emissions).
  • Takeaway: Parking demand may sharply decline, but what parking is left will need significant EV infrastructure. Loading/valet zones will quickly need to be implemented. Consumer spending on cars could be pivoted to other spending, like higher-quality real estate.

City Observatory (Joe Cortright) [part 1] [part 2]:

  • RMI’s cost estimates of <$0.50/mile are roughly in line with other published estimates, with lower costs associated with smaller/lighter vehicles. This is lower than the per-mile cost of not just driving, but even short transit trips.
  • However, $0.50/mile is much higher than the perceived $0.15-$0.20/mile marginal cost that most Americans assume for private-auto trips. (Most Americans only consider the cost of gas when driving; costs such as depreciation/wear, insurance, repairs, monthly parking, and wasted time are all considered sunk.)
  • “Pay by the slice” mobility, like car-sharing, tends to encourage shorter trips. Pricing will probably be more, not less complex, with various “surge” surcharges that use information to optimize the balance between travel demand and supply.
  • Rush-hour capacity will still be an issue, especially in high-density downtowns. Rail transit, walking, and cycling will still move more people in less space.
  • Takeaway: Mobility won’t be “too cheap to meter,” as optimists once said of nuclear electricity. As such, central locations will still matter, even if price differentials flatten somewhat. (TNCs are already “filling in the lines” between transit corridors and increasing the value of secondary urban locations.) Whether dense downtowns built around rail/walking remain useful is an open question.

What everyone agrees upon is that this is the first huge shift in metropolitan mobility since the 1940s-1980s shift towards mass car ownership. It’s important to remember that American suburbia is a political and social construct, not a fact of life, and that policies put into place immense structural supports for American suburbs.

Brand-new timber loft offices, now for lease

N. Vancouver Ave. frontage of One North

Last week, I published a ULI Case Study about One North in Portland, an architecturally inventive response to my previous speculation that “new-build loft offices could be popular in similar downtown-adjacent submarkets, and transformative for Sunbelt cities where sparse ‘warehouse districts’ have little competing product.”

Indeed, the anchor tenant at One North is a mid-sized tech company that had outgrown its space in Portland’s Central Eastside. As in many other growing cities, there just wasn’t a cool old loft big enough, so instead they found a cool new loft.

T3 Minneapolis under construction

Southwest corner of T3 Minneapolis, showing CLT column stacked above concrete podium

I also had a chance last week to check in on T3, Hines’ new cross-laminated timber office building in Minneapolis. Less than a year after groundbreaking, the structure is complete and the facade is almost completely hung — almost a year faster than a comparably sized concrete building takes to build. The superstructure took less than 10 weeks to build.

The model is so successful that Hines is now replicating the T3 building at another location that’s even hungrier for lofts: Atlantic Station in Midtown Atlanta.

Here in DC, one great location could be the PDR-2 zoned land (90′ height permitted with setback, no residential) on the west side of the Met Branch Trail along Eckington and Edgewood, one of the hottest corridors in town. Another could be around Union Market/Gallaudet, where JBG’s Andrew VanHorn says “we see the tenant base there evolving. The pre-lease opportunities we’re talking to for our office building are all private market, very young companies, as far as their employee demographics.” Or maybe this is what his firm has in mind for the “creative loft office” at RTC West.

An aside: this is another strike against “Investment Ready Places.” It sounds counter-intuitive, but it’s easier to move buildings to people than to move people to buildings. The “good bones” that economically unviable places have can have “good enough” replicas in New Urbanist settings like Atlantic Station and Reston Town Center. Not to mention that building all of the new infrastructure to overcome IRPs’ deficient locations, and then rehabilitating their buildings to code, would be much more expensive than just building anew in prime locations. It’s cheaper and easier to build new lofts in Reston than to rehab lofts in West Baltimore, and to build the new rail connection that would make West Baltimore feasible for NoVA’s growing companies.

Cities are built around people, not the other way around.

2017 update: Construction has started on an 800,000 sq ft HT building on the Brooklyn waterfront.

DC has “parking craters,” just not downtown. Here’s why.

Most American downtowns are surrounded by “parking craters,” as Streetsblog has termed them. Here in DC, downtown’s successful redevelopment has almost eliminated downtown parking craters, with one key exception. This success hasn’t completely eliminated parking craters from DC, though — it’s just moved them outside downtown.

parking crater at CityCenterDC

DC’s last privately-owned parking crater has a very unusual backstory. Gould Property owns the site free and clear, but only due to a land swap to get the Marriott Marquis built two blocks north. Gould had purchased part of the Marriott site back in the 1990s, when prices really were cheap enough to justify parking craters. The land basis and opportunity cost on this site is unusually low, especially since the former building on the site could not have remained.

Most surface parking lots are built as what zoning calls “an accessory use,” which means they’re an “accessory” to something else on the same lot. The parking lot at Sam’s Park & Shop in Cleveland Park or the Capitol’s parking lots, are “accessory” parking lots.

Parking craters, on the other hand, are usually not accessory parking directly tied to another land use; they’re paid parking lots whose owners are holding onto land that they speculate could be a future development opportunity. A parking lot requires minimal maintenance, but pays out some income in the interim. Most importantly, a parking lot is “shovel ready” — unlike a building with tenants in place, whose leases might or might not expire at the same time, a parking lot can be emptied and demolished on short notice when opportunities arise.

High rents and short buildings limit speculation

The opportunity that many “parking crater” developers are waiting for is the chance to build a big office tower. Offices pay higher rents to landlords than apartments (although in the best locations, retail or hotels can be even more valuable). However, the banks who make construction loans to developers rarely allow new office buildings to be built before a large, well-established company has signed a long-term “anchor tenant” lease for much of the new building’s space. If the building isn’t pre-leased, the result can be a bank’s worst nightmare: a “see-through tower” that cost millions of dollars to build, but which isn’t paying any rent.

Within downtown DC, robust demand and high rents mean that landowners face a very high opportunity cost if they leave downtown land or buildings empty for a long time. Instead of demolishing buildings years before construction starts, developers can make room for new buildings by carefully lining up departing and arriving tenants, as Carr Properties did when swapping out Fannie Mae for the Washington Post.

Less often, a developer will build new offices “on spec,” or without lease commitments in place. A spec developer usually bets on smaller companies signing leases once they see the building under construction. Downtown DC has a constant churn of smaller tenants (particularly law firms and associations) that collectively fill a lot of offices, but few are individually big enough to count as anchor tenants.

Because office buildings in DC are so short, they’re relatively small, and therefore the risk of not renting out the office space is not that high. In a city like Chicago, by contrast, few developers would bother building a 250,000 square foot, 12-story office building to rent out to smaller tenants. Instead, they could wait a few more years and build a 36-story building, lease 500,000 square feet to a large corporation, and still have 250,000 square feet of offices for smaller tenants.

While height limits certainly constrain the size of offices in DC, other cities with much less stringent height limits have also managed to eradicate most of their parking craters. Boston and Portland are similarly almost bereft of parking craters within their cores, not because of Congress but because other planning actions have maximized predictability and minimized speculation. In both cities, small blocks and zoning-imposed height limits of ~40 stories (!) encourage construction of smaller office buildings

Another factor common to these cities are policies also encourage non-car commutes — Boston even banned new non-accessory parking downtown — and rail transit that distributes commuters through downtown, rather than focusing access along a freeway or a vast commuter rail terminal. Metro’s three downtown tunnels, and DC’s largely freeway-free downtown, help to equalize access (and property values) across a wide swath of land. In retrospect, it’s impossible to identify which one factor had the greatest effect.

This customer is always right

There is one big anchor tenant in DC’s office market: the federal government. The government has some peculiar parameters around its office locations, which also help to explain where DC does have parking craters.

Private companies often don’t mind paying more rent for offices closer to the center of downtown, which puts them closer to clients, vendors, and amenities like restaurants, shops, or particular transit hubs. The government, on the other hand, has different priorities: it would rather save money on rent than be close-in. The General Services Administration, which handles the government’s office space, defines a “Central Employment Area” for each city, and considers every location within the CEA to be equal when it’s leasing offices. It also usually stipulates that it wants offices near Metro, but never specifies a particular line or station.

As rents in prime parts of downtown rose, the government began shifting leased offices from the most expensive parts of downtown to then-emerging areas. Large federal offices filled new office buildings in the “East End,” helping to rejuvenate the area around Gallery Place and eliminate many parking craters.

This one rule scattered “parking craters” all around DC, but they’re steadily disappearing

Over the years, DC noticed the success it found in broadening the federal government’s definition of the Central Employment Area, thereby spreading federal offices to new areas. It successfully lobbied GSA to widen the CEA further, encompassing not just downtown but also NoMa, much of the Anacostia riverfront, and the former St. Elizabeth’s campus. Because the latter areas have much cheaper land than downtown DC, and lots of land to build huge new office buildings, federal offices are now drifting away from the downtown core.

A developer with a small site downtown usually won’t bother to wait for a big federal lease: the government wants bigger spaces at cheaper rents. It’s easier to just rent to private-sector tenants. However, a developer with a large site within the CEA and next to Metro, but outside downtown, has a good chance of landing a big federal lease that could jump-start development on their land — exactly the formula that can result in a parking crater.

One recent deal on the market illustrates the point: the GSA recently sought proposals for a new Department of Labor headquarters. GSA wants the new headquarters to be within the District’s CEA, within 1/2 mile walking distance to a Metro station, and hold 850,000 to 1,400,000 square feet of office space.

The kicker is the timeline: GSA wants to own the site by April 2018, and prefers if DC has already granted zoning approval for offices on the site. It would be difficult for a developer to buy, clear, and rezone several acres of land meeting those requirements within the next two years, so chances are that the DOL headquarters will be built on a “parking crater” somewhere in DC. Somewhere outside downtown, but within the CEA, like:

Parking crater at Spooky Park, Yards

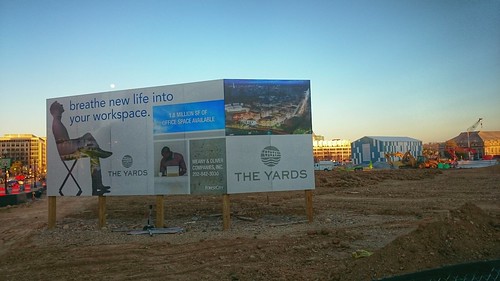
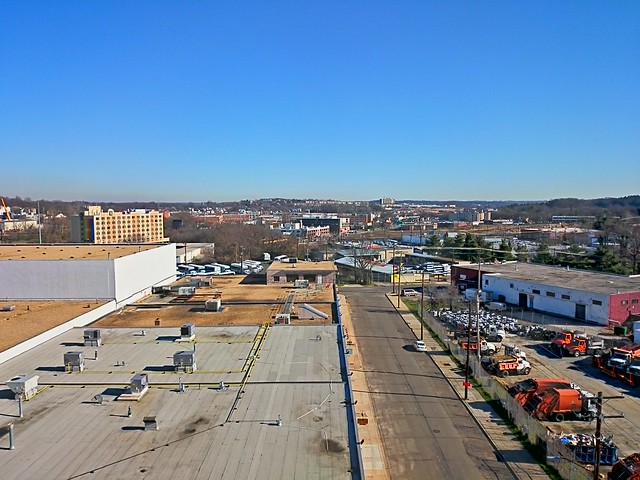
Parcel A at the Yards.

  • “Spooky Park,” or Parcel A at The Yards, formerly the National Geospatial-Intelligence Agency offices across from the Navy Yard Metro. It’s zoned for 1.8 million square feet of offices, and is probably the largest single parking crater in DC.
  • Behind the Big Chair in Anacostia are several parking lots that could house a million square feet of offices.
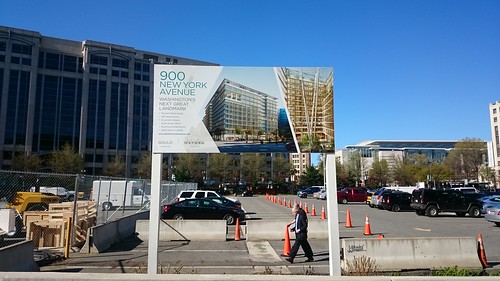
  • The Portals, next to the Mandarin Oriental Hotel at 14th and D streets SW, has two empty lots left. A residential tower will soon sprout on one, but the other is being reserved for another office building, across from to another building that was built for the FCC, but which will soon be vacant.
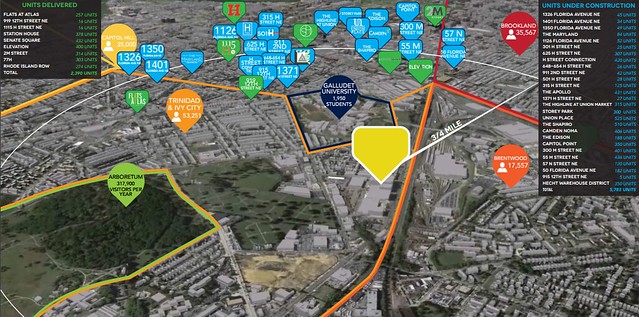
  • The two blocks just west of the Wendy’s at “Dave Thomas Circle,” in the northwest corner of NoMa, are owned by Douglas Development and Brookfield Asset Management. Brookfield’s site could house 965,000 square feet of development, and Douglas’ site could have a million square feet.

High-rise residential seems like it would be an obvious use for land like the Yards, which is outside downtown but atop a heavy-rail station. Yet even there, where one-bedroom apartments rent for $2,500 a month, it’s still more valuable to land-bank the site (as parking, a small green area, and a trapeze school) in the hopes of eventually landing federal offices.

Many federal leases are also signed for Metro-accessible buildings outside the District, which helps to explain why prominent parking craters exist outside of Metro stations like Eisenhower Avenue, New Carrollton, and White Flint. (For its part, Metro generally applauds locating offices at its stations outside downtown, since that better balances the rush-hour commuter flows.)

One reform could fix the problem

One esoteric reform that could help minimize the creation of future parking craters around DC is to fully fund the GSA. Doing so would permit it to more effectively shepherd the federal government’s ample existing inventory of buildings and land, and to coordinate its short-term space needs with the National Capital Planning Commission’s long-term plans.

Indeed, GSA shouldn’t need very many brand-new office buildings in the foreseeable future. Federal agencies are heeding its call to “reduce the footprint” and cut their space needs, even when headcount is increasing. Meanwhile, GSA controls plenty of land at St. Elizabeth’s West, Federal Triangle South (an area NCPC has extensively investigated as the future Southwest EcoDistrict), Suitland Federal Center, and other sites.

However, ongoing underfunding of GSA has left it trying to fund its needs by selling its assets, notably the real estate it now owns in now-valuable downtown DC. GSA does this through complicated land-swap transactions, like proposing to pay for DOL’s new headquarters by trading away DOL’s existing three-block headquarters building at Constitution and 3rd St. NW.

In theory, it should be cheaper and easier for GSA to just build new office buildings itself. In practice, though, they’ve been trying to do so for the Department of Homeland Security at St. Elizabeth’s West — a process that Congressional underfunding has turned into a fiasco.

Parking craters will slowly go away on their own

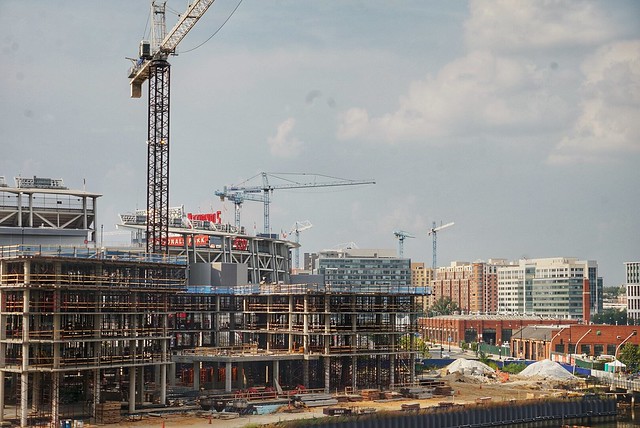
In the long run, new parking craters will probably rarely emerge in the DC area. Real estate markets have shifted in recent years: offices and parking are less valuable, and residential has become much more valuable. This has helped to fill many smaller parking craters, since developers have dropped plans for future offices and built apartments instead.

Goodnight, parking crater

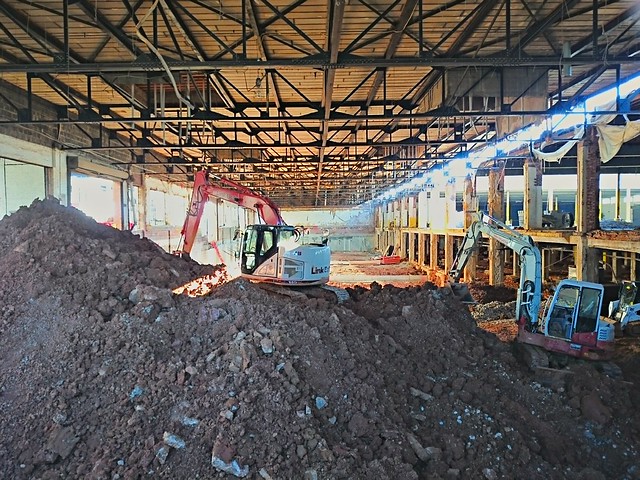
A parking crater in NoMa that’s soon to be no more, thanks to apartment development.

Even when developers do have vacant sites awaiting development, the city’s growing residential population means that there are other revenue-generating options besides parking. “Previtalizing” a site can involve bringing festivals, markets, or temporary retail to a vacant lot, like The Fairgrounds, NoMa Junction @ Storey Park, and the nearby Wunder Garten. This is especially useful if the developer wants to eventually make the site into a retail destination.

Broader trends in the office market will also diminish the demand for parking craters, by reducing the premium that big offices command over other property types. Demand for offices in general is sliding. Some large organizations are moving away from having consolidated headquarters, and are shifting towards more but smaller workplaces with denser and more flexible work arrangements.

Unlike the boom years of office construction, there’s now plenty of existing office space to go around. Since 1980, 295 million square feet of office buildings were built within metro DC, enough to move every single office in metro Boston and Philadelphia here. While some excess office space can be redeveloped into other uses, other old office buildings — and their accessory parking lots — could be renovated into the offices of the future.

A version of this appeared in Greater Greater Washington.

Ivy City: who goes there?

Hecht Warehouse, Ivy City, DC

The view northeast from the Hecht Warehouse’s parking garage, towards “NewCityDC.” 

Last month, Douglas Development filed plans for NewCityDC, which will bring more than half a million more square feet of retail space to the New York Avenue NE corridor, adjacent to the substantial residential and retail investments it’s gradually opening around the old Hecht Company warehouse in Ivy City.

NY Ave, aka US 50, is the only full-on traffic sewer in DC, with six through lanes, a speed limit up to 50 MPH. For a three-mile stretch between the Maryland line and Florida Avenue (the boundary of the L’Enfant city), it’s paralleled on the north by a trench holding the Northeast Corridor railroad and cut off to the south by a variety of institutions (the arboretum, Gallaudet University, cemeteries), and thus has only a handful of intersections with the street grid. That proximity to the railroad brought both low-density industrial buildings and a Skid Row feeling to the blocks surrounding it. The street hardly has sidewalks, definitely does not have bike lanes, and doesn’t even have a city bus route.

Yet despite all that, Douglas — who has made a fortune turning around the East End of downtown DC — thinks there are customers for 300,000 square feet (a regional mall’s worth, net of the anchor stores) of specialty retail in this isolated location. And they’re sinking lots of money into the area; this is some very heavy-duty and expensive work to do for single-level retail:

After Hecht, Douglas' next retail building

Douglas’ marketing would have retailers think that there are lots of customers right at their doorstep, thanks to dubious maps like this “trade area analysis”:

hecht2

The map gooses up the demographics by drawing a “15-minute drive time” radius that brings everything from College Park to Georgetown to Pentagon City into the mix — even though

  1. Georgetown is almost never a 15-minute drive to Ivy City;
  2. More than half of households in the Census tracts surrounding Ivy City do not own cars, along with about 40% of central-city households;
  3. Most residents west of this site may be only scarcely aware that New York Avenue, much less Ivy City, exists.

“Average household income” is basically meaningless, especially in prosperous (and expensive) metro DC, since all three of those figures are substantially below the city average of $106,000.

A site-and-vicinity map is even more misleading:

hecht1

This map highlights thousands of apartments that are being delivered around NoMA. Never mind that many of those new units don’t have parking spaces (since most of the city’s new households don’t have cars), which will make it nearly impossible for their residents to get to Ivy City.

Sure, Hecht is a 4-minute drive from NoMA, and a mere 3/4 mile for any birds who are roosting atop its new high-rises. But for most anyone who actually lives in NoMA, it’s nearly half an hour away (by bus and foot) — during which time that resident could have just gone to Metro Center (with 15 minutes to spare) or Pentagon City or Silver Spring. In short:

The real market for Hecht, NewCityDC, and Fort Lincoln’s retail is exactly what you’ll see in the parking lot at the Costco at the latter: lots of Maryland license plates. All of these are set up for easy right-in/right-out access for drivers headed outbound on US-50, who don’t have many other shopping choices until Bowie or Annapolis. That market is certainly underserved — but it’s much smaller than the one that Douglas’ maps promise. Economic development officials in Prince George’s County should take note.

Friday photo: Incrementalist lessons from Seaside

Seaside lessons: plan for evolution, not revolution

The ULI office is moving in a few months, so a lot of old files are being tossed out. One that I saw poking out of a garbage can was a 1986 Project Reference File written about Seaside, Florida. The “lessons learned” section worth excerpting, if only because it doesn’t talk about the PoMo architecture, or even the planning — instead, it’s all about the incremental nature of the development.

Most resort development today is characterized by a highly refined design concept coupled with central ownership and tight control over design and building decisions. In contrast, Seaside’s approach is to encourage authentic diversity by delegating to others as many design decisions as possible, within the dictates of a sophisticated urban design plan….

A significant factor in Seaside’s development is that, by owning the land outright, Davis was able to 1) invest in a considerable amount of upfront planning, and 2) proceed cautiously with the development. By going slowly, he says, a developer can reduce risk and can correct small mistakes. At Seaside, the master plan was not recorded until after the developer had had several years of experience with building and marketing this unique product. This allowed for minor refinements in the development strategy, plan, and timing, while prices rose accordingly….

Instead of assuming that large upfront investments in amenities would produce marketing payoffs, the developer moved slowly and carefully, guided by the master plan.

In short, plan far ahead, regulate what matters, and phase to allow adaptation and evolution. (Evolution, not revolution.) Alas, the world still has a lot to learn from Seaside.

This point is echoed by Peter Cookson Smith in a book that I’m reading about Hong Kong, a seemingly very different place:

Overly engineered environments leave little flexibility to make incremental adjustments in response to the evolving economic circumstances that normally represent the lifeblood of towns and cities.

The crisis sharpened the segregation tax, with effects that will reverberate for generations

This sharp illustration of “the segregation tax” comes courtesy of DePaul’s Institute for Housing Studies. Calumet City has a housing stock comparable in age to that in Park Ridge or Des Plaines (areas whose development started in the 1920s, but mostly occurred in the 1950s); Harvey’s is mostly post-war. Similarly, Chatham, Auburn-Gresham, and Avondale all are principally 1920s bungalows and two-flats, with Logan Square having a large fraction of pre-WW1 houses and flats.

Prices in the mid-2000s boom rose substantially in all neighborhoods, fed by ample access to both prime and subprime loans. Even “during one of the hottest housing markets ever, our numbers were showing black buyers still experienced [home equity] losses,” notes Scott Holupka, pointing to disadvantageous subprime loans and inflated prices in segregated neighborhoods.

But the picture in the aftermath of the 2008 crisis has been terrible for majority-Black areas on the South Side, like Calumet City, Harvey, Chatham, and Auburn-Gresham. The “boom” has left huge numbers of Black homeowners underwater, without access to a ready market of creditworthy buyers, and in neighborhoods with sinking home values. On the White or Latino-plurality North Side, values didn’t fall as far during the bust, and have rebounded further since.

These diverging fortunes show that simply achieving milestones like buying a home, or graduating from college, isn’t enough — a deed or diploma’s value is socially constructed, and subsequent policies can do much to determine their future value. A study by Demos finds that the subsequent returns to education and homeownership matter just as much as equalizing access to such wealth-building opportunities:

Eliminating the racial disparity between Blacks and Whites in… would reduce the wealth gap by:
– Homeownership rates: -31%
– Returns on homeownership: -16%
– College graduation rates: -1%
– Returns on college graduation: -10%
– Incomes: -11%
– Returns on income [nil]

Note that equalizing incomes today won’t necessarily have an impact on the wealth that Black families will be able to pass on to future generations: “Even with equal advances in income, education, and other factors, wealth grows at far lower rates for black households because they usually need to use financial gains for everyday needs rather than long-term savings and asset building.”

Mel Jones, in a recent Washington Monthly article, points to how the widening wealth gap presents a particular disadvantage to young Americans of color:

You can’t discuss wealth inequality without talking about race; within the American context, they are inseparable. So the fact that Millennials of color feel the impact of a precarious financial foundation more acutely is not a surprise. For black Millennials in particular, studies point to a legacy of discrimination over several centuries that contributed to less inherited wealth passed down from previous generations. This financial disparity stems from continuous shortfalls in their parents’ net worth and low homeownership rates among blacks, which works to create an unlevel playing field.

Whereas many white Boomers may have used home equity loans to help pay college tuition bills, many black Boomers have negative equity to invest in their children’s education, in their own health, in getting their grandchildren a solid start. The accumulated disparities will cascade down to future generations.

Policies to more equitably distribute the returns on homeownership will have to act on both sides of the crosstown divide — not only lifting up the disadvantaged, but also moderating the outsize gains enjoyed by the “favored quarter.” Economic development should occur more equitably across regions, to help boost demand. However, this difficult task will be easy compared to better integrating the favored quarter, bringing more people closer to high-opportunity places.

“Build all the new housing in downtown’s backyard” isn’t working out well for DC

Construction around Navy Yard Metro

Part three of my multi-part series about housing production in DC went live on GGWash this week. Further installments will examine the impact of so much new housing construction on how central-city neighborhood planning — and begin to examine alternative forms that new housing besides central-city high-rises.

Part 1 – DC built 13% less housing over the past decade than its own citywide plan calls for: In 2006, DC adopted a Comprehensive Plan to guide its development efforts. At the time, the District’s population had just started to perk up after six decades of decline, and the plan reasonably foresaw that growth could continue into the future. The District’s population has indeed grown substantially, but its housing stock isn’t keeping pace.

Part 2 – The lion’s share of DC’s new housing is only going in one part of the city: Over the last decade, DC has built 13% less housing than its Comprehensive Plan calls for. Of the new housing that is going up, most of it is confined to the central city even though the plan recommends only 30% go there. Meanwhile, most parts of the District are building little or no new housing.

Part 3 – Most of DC’s new housing is in high-rises, which most people can’t afford to live in
At first glance, the District’s central-city housing boom might seem to be completely benign: as long as new housing is being built, does it matter where it is? But by funneling almost all new residences into central-city high-rises, the District is all but requiring that new housing be built with only the most expensive construction techniques, on the most expensive land. Potential residents need more choices.

How growing income inequality affects places, part 2: The favored quarter gets richer, the wrong side of the tracks still suffers

The same divergence in fortunes appears to be accentuating price differentials between metropolitan sectors (essentially, “sides of town”). In an economy where the rich are getting richer than everyone else, the rich side of town is also increasing its comparative advantage over everywhere else.

LA office rents

This split was apparent during a recent trip to Southern California. The region might still be “polycentric,” but where one side of town — the Westside favored quarter — now completely dominates local wealth creation. What were merely lopsided prices before have now become absurdly imbalanced, with mediocre buildings on the Westside commanding top rents while perfectly nice areas, like Long Beach and Pasadena, are lagging badly.

In cities where houses or offices on the “right” side of town are scarce, such real estate becomes a privilege only available to the wealthiest people — who, as we’ve noted, are getting wealthier, and in large part because of their houses on the “right” side of town. Even though real estate prices generally track local incomes, the favored quarter of Los Angeles now has prices that track only the exploding incomes of the ultra-rich.

This Redlands ISEA animation of LA-area housing prices from 1988 to 2011, over the course of several cycles, illustrates the “flight to quality” that has occurred during the three busts (mid-90s, early-00s, 2010). At the start, high-value areas are relatively well dispersed across the basin, with only the inner city (particularly the near south and east) suffering from low prices. But, over time, the cumulative advantage of being near the beach increases over time — especially because prices don’t fall as much during the busts, but grow by just as much during the booms.

The trend is perhaps in sharpest relief in high-Gini areas like LA, but is broadly occurring across the country. Joe Light reports in the Wall Street Journal that lower-priced houses are lagging even as prices nationally rebound:

Between January 2006 and May of 2015, the median value of homes in the bottom third of the market has dropped 13% to $101,900, according to Zillow. The median in the middle third is down 6% to $172,600, while in the top third it is off 4.5% to $325,800… The [disinvestment] cycle has been hard to break in large part because low-wage workers have seen little, if any, income growth during the recovery—putting them in weak position to qualify for mortgages.

Recently, Rolf Pendall at the Urban Institute identified the most and least privileged neighborhoods in metro areas nationwide in the 1990, 2000, and 2010 censuses. Over those two decades, the most privileged neighborhoods saw home values rise by an extra $80,000, and their residents actually benefitted from that gain — their homeownership rate is twice as high as in the least privileged neighborhoods. (Since fewer than half of households in the least privileged areas are homeowners, their property value gains accrued to someone else.) Privileged neighborhoods also stockpiled human capital: the growth in their college attainment rate was four times higher than in the least-privileged areas.

This has tremendous implications for intergenerational social mobility, which is closely tied to income, human capital, and wealth. Not only do wealthier families have more private resources for their children, but in a country where schools are largely funded with local property taxes, wealthy communities have more public resources for their children. Three generations ago, legal segregation awarded suburban nest eggs to white families while denying black families the same opportunity — resulting in a “titanic wealth gap” between the races today. (Furthermore, generations of zoning have sought to freeze this status quo, and perpetuate the original injustice)

Thus, the “segregation tax” that penalizes property values in majority-minority communities creates a vicious cycle both for families and for communities, and one that is only getting more pernicious — sadly illustrated recently by the events in Ferguson, Missouri.

Locally, stagnant housing prices in Prince George’s County have contributed to an ongoing foreclosure crisis. Stagnant housing demand from the “underwater limbo” is compounded by its relative isolation from the favored quarter’s jobs engine, and the area’s ongoing “segregation tax” discount. For example, in 1965-1975, the Levitt firm built two large “Levittowns” in suburban DC — Belair in north Prince George’s and Greenbriar in south Fairfax. Even though these are the favored and less-favored sides of their particular counties, near-identical ranches recently sold for an average of $300K in Bowie and $440K in Fairfax.

(An even more striking dynamic can be seen in the Philadelphia area’s twin LevittownsLevittown, PA has property values twice as high as Willingboro, NJ. What’s more, over the 2007-peak-to-2012-trough cycle, Levittown property values declined by only 25%, whereas Willingboro values declined by 50%. And yet, all of the Levittowns began as mostly or exclusively white.)

Meanwhile, formerly moribund downtowns adjacent to job-creating Favored Quarters are finding some success reinventing themselves as the easiest place to add new residential, away from the fierce FQ NIMBYs. The boom in downtown LA’s residential and retail market diverges sharply from its flatlining office market — which still suffers from 20%+ vacancy even though dozens of office towers have been converted to other uses. Downtown Atlanta and Dallas are similarly benefitting from escalating prices to their north.

Friday photo: Greedy developers built your city

Two rental houses on Capitol Hill

I recently came across these plans by a fantastically wealthy land speculator, seeking to profit by ruining DC’s pristine Capitol Hill neighborhood with a towering building crammed full of tiny rental “microunit” apartments for immoral singles — rather than wholesome nuclear families! This kingpin practices his avarice from posh Fairfax County, within a “resplendent” mansion overlooking the Potomac.

This paragon of greedy, out-of-town developers is, of course, George Washington, the very namesake of Washington city. (Yet another greedy developer, Alexander “Boss” Shepherd, is memorialized with a statue right outside the Wilson Building.) Cities don’t arise via immaculate conception; they’re built by developers.

John DeFerrari’s book Lost Washington has a much more detailed account of the houses, showing that the NIMBY nightmare of “out of scale” “overdevelopment” was indeed what this city, and all other cities, was built on. (Otherwise, we’d all still be in caves!) Washington wrote to his architect, “Although my house, or houses… are I believe, upon a larger scale than any in the vicinity… capable of accommodating between twenty and thirty boarders.” A later, even greedier, developer popped up (and popped-under) the ruined buildings in the aftermath of 1814’s fire, and the buildings grew to six stories tall. Anti-pop-up NIMBYs might take heart from its fate: it then descended into criminal infamy and was bulldozed for a park.

[The plans in the photo above are from GW’s Albert Small Collection. More background, including photographs and illustrations of the houses at various points in time, is at Streets of Washington.]

How growing income inequality affects places, part 1: Rich metros are getting richer

graphs from Emerging Trends 2015

No, it’s not just you: prices are increasing faster in gateway cities than in “nonmajor markets.” Graph from ULI/PWC’s 2015 “Emerging Trends.”

One of the over-arching trends in the post-industrial economy is that the rich are getting richer, to a great extent because technology makes it easier to increase returns towards a few, at the expense of the many. Researchers have recently found that a substantial proportion of wealth inequality is due to higher housing prices — so, it stands to follow that the places which house rich people would also get richer.

Earlier, I wrote that previously accumulated human capital advantages means that “The most valuable places are becoming even more so: they account for not only an outsized share of wealth but also the gains of recent years.” This appears to be taking place both between metro areas and within them.

The combination of recession and recovery have had very differential impacts on metro areas, according to the Brookings MetroMonitor. Metro economies whose wealth was tied to housing or manufacturing have lagged, while those tied to technology and energy have grown substantially. (Necessary caveats: This map shows change in gross output, which is heavily influenced by population — both baseline and growth. Thus, it may overstate growth in smaller, faster-growing metros and understate growth in larger, slower-growing metros. Also, the fossil-fuel extraction industry has done very well recently, explaining one-third of Texas’ relative gains, but past performance does not necessarily predict future results.)

GMP change in recent years

So, to some extent, differential price gains are related to income gains — after all, property prices generally track local incomes. Yet prices in first-tier cities, as shown in the graph above, are increasing even faster than incomes, and some form of the hated “speculation” may be at fault. Property in these so-called “gateway cities” is an increasingly popular investment for institutional capital — the money managers who store wealth for the rich. Institutional investors have raised their allocation to real estate by over 50% since 2010; super-low interest rates on cash seem to be behind a surging interest in “alternative asset classes.”

Gateway cities’ large markets and great name recognition means that their real estate values are more stable, transparent, and liquid than smaller cities’ markets. Investors are willing to buy property in gateway cities at lower yields, and thus higher prices (from CBRE’s 2nd half 2014 capitalization rate report):

CBRE 2H2014 cap rates east

Buyers in Baltimore expect 7% yields on their investments, while buyers in DC expect 4.75%. That doesn’t sound like a huge spread, but it’s a 47% difference — a building earning $1M a year in income would command a price of $14,285,714 in Baltimore, but $21,052,631 in DC.

Note that the list is bifurcated: Boston, DC, and NYC, the gateway cities, are all 5% or under, and everywhere else is 6% or up. Investors are willing to pay a lot more money to get the same income in larger (and more reliable) markets, and so prices get bid up.

The same factors that draw equity (ownership) investment to gateway cities also draw commensurate amounts of debt investment — amplifying equity’s effects two to four-fold. Leverage creates a vicious cycle, as we saw during the housing boom: Banks lend based on comparable sales; higher comps mean higher prices are justified, which results in more debt, which raises comps even higher for the next guy.

Friday photo: The first sprouts in a freshly plowed field will be weeds

Country road again

An ecological analogy for retail:

Many of the plants we call weeds originally evolved in tough conditions, where there is annual glaciation, periodic flooding, or severe fires – extreme events that leave exposed, bare earth. It’s in these devastated conditions that our weeds are at home. They germinate first and grow the fastest. And through these characteristics they have found important roles in re-establishing healthy ecosystems… Once the weeds are established, longer-lived plants, less adapted to disturbance, germinate and the process of succession begins. The process may end in a grasslands, woodlands or forest, depending on the soil and climate. Indeed, the weeds create the conditions of their own inevitable demise – inevitable unless of course the disturbance recurs.

The “weedy species” that so many bemoan, the token dry-cleaners and fast-food joints that sprout in brand-new buildings, are one key to building a retail market. Over time, better adapted shops will take root — and given enough stability, species will evolve into very specific ecological niches. These new species will both adapt to their environment, and also change the environment around them. The key is to give the habitat time to evolve by avoiding excessive disturbance — a condition ecologists call “disclimax.”

Cultivating biodiversity requires striking the right balance between stability and renewal. The goal should be less to conserve individuals than to maintain the health of overall communities, to not seek out stasis forever but to manage change for the long term.

Gradual change within human communities also helps to sustain and build linkages, according to a paper by sociologist Katherine King: “A gradual pace of redevelopment resulting in historical diversity of housing significantly predicts social relations.”

Friday photo: Be careful what your zoning asks for

In the Penn Quarter neighborhood, as Mark Jenkins wrote in the Washington Post, “arts spaces are mandated by zoning, yet the arts scene is hard to find. Nearly a dozen exhibition spaces populate the area… most don’t have access to the street and aren’t clearly identifiable from outside. They are in lobbies or tucked away in office building interiors.” Here’s one, Terrell Place at the prime corner of 7th & F, that’s not entirely hidden — but also not exactly shouting its noble story to the public. Yet it’s somewhat striking in that it wastes what could be prime retail space across from the National Portrait Gallery and the Verizon Center arena.

The “arts” designation for the “Gallery Place” neighborhood was intended to foster a vibrant community of commercial art galleries alongside working artists, all in the shadow of the Portrait Gallery. Yet instead, there are scarcely any commercial galleries, which require considerable staff investment, and instead many pointlessly large office building lobbies which feature above-average displays of plop art. Perhaps some lawyers and lobbyists have their lives slightly enriched by walking past these paintings, but the general public now derives scant benefit.

The designation is so broadly written that at least two suspiciously spacious bars on E Street — Penn Social and Hill Country Barbecue — both owe their existence to the “arts” requirement. I’m glad that Penn Social has room to spare; it’s a reliable go-to for large events that might not otherwise fit into such a convenient downtown location. But was that really the intent of the zoning?

The situation illustrates the difficulty of trying to define great places, which depend upon a lot of “we know it when we see it” subjectivity, through legal means like zoning. Now that quality retail has emerged as the prime placemaking amenity — anywhere can have open space, but retail’s a lot more difficult — it’s also become something worth subsidizing for its placemaking value. Yet before you can subsidize something, you have to define it.

Doing so will be fiendishly difficult for public entities like municipalities, which will also run into arguments about whether retail is a public good or a private good. However, it should be easier for private entities seeking to cross-subsidize across revenue streams.